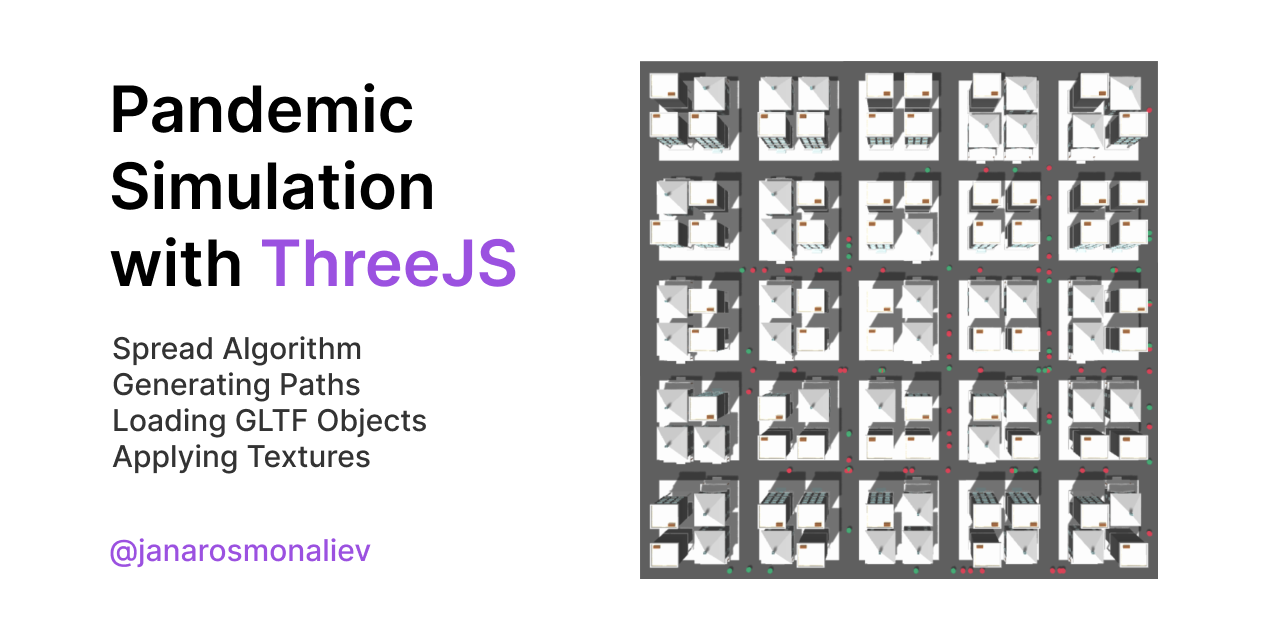
This is a final project for CSE487 course under StonyBrook University curriculum. The project aims to show different tendencies of how pandemics spread and allows the user to directly affect the course of events in this city populated with synthetic blobs. It was build using ThreeJS and bundled with Webpack.
Before you jump into the demo, you must be familiar with the controls and know how exactly they affect the simulation. Some controls affect the simulation dynamically, some of them need the application to be reloaded.
| Controls | Description | Effect |
|---|---|---|
| Population | Number of blobs living in the city. Default is 100. | Reload needed |
| Blob speed | Movement speed of blobs. Does not affect the performance. | Dynamic |
| Infected blobs | Initial number of infected blobs. | Reload needed |
| Infection chance | Probability of a blob infecting another blob upon contact in %. | Dynamic |
| Physical contacts per blob | Number of blobs that each infected blob contacts with. | Dynamic |
| Show paths | Shows the graph of movement paths for each blob | Reload needed |
| Play/stop animation | Stops the simulation. Camera movement will be disabled too | Dynamic |
| Reload | Reloads the simulation with selected settings | N/A |
Now, you can go ahead and play around with the simulation.
One day is counted in terms of blobs' two way travel from home to work. So, on each day, each infected blob transmits the disease with an $infectionChance to random $contactedWithBlobs number of blobs, whether they are already infected or not. I thought that would resemble the real-life conditions of the disease spread.
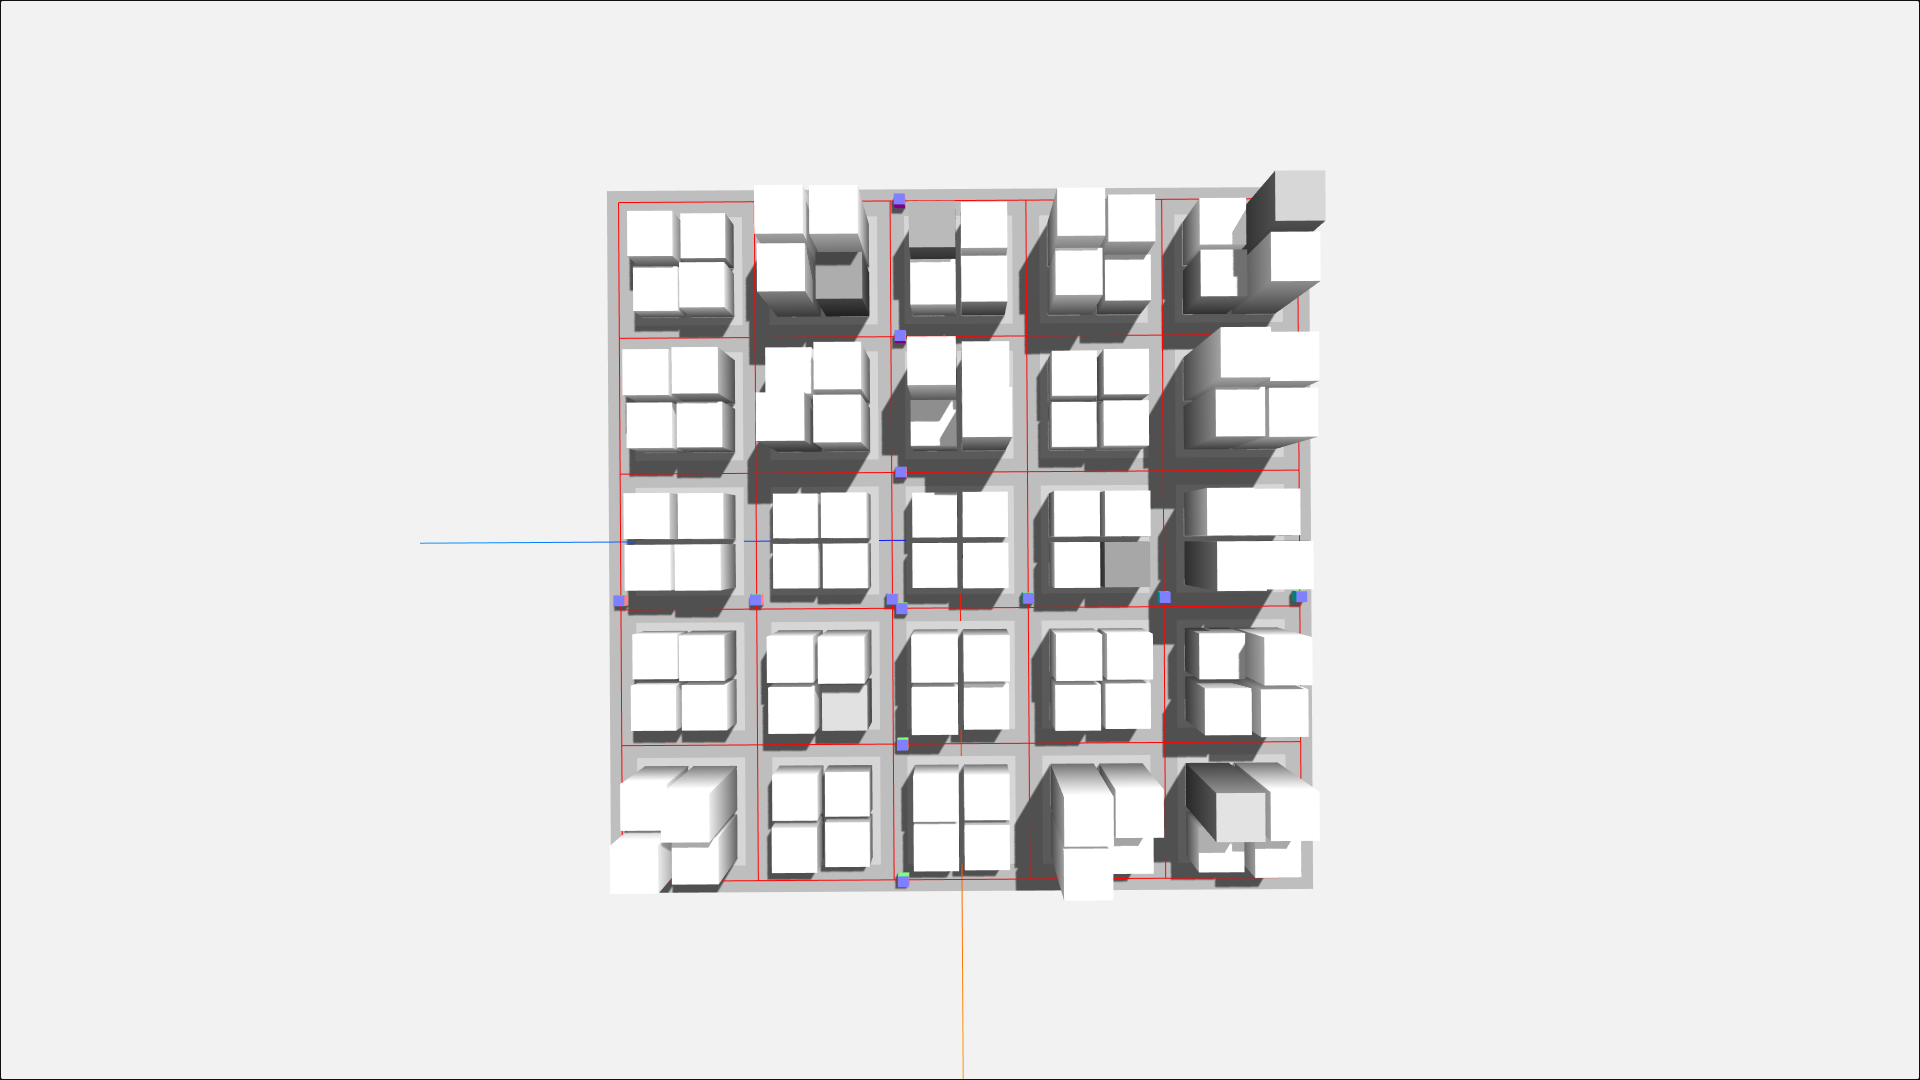
The algorithm assigns the blob with two random houses. Since the city's structure is fairly simple, the graph path is generated empirically, using building's district index and position within. Using complex algorithms like Djikstra would have overcomplicated things, e.g. a 5x5 district city with 4 buildings within each would need a graph with 84 nodes and 94 edges!
I used free 3D objects and converted them into GLTF 2.0 objects through Blender with UVs saved. Then imported them into ThreeJS with:
import { GLTFLoader } from "three/examples/jsm/loaders/GLTFLoader.js";
import GLTFObject from "./objects/Flat.gltf";
import GLTFObjectUV from "./objects/HouseTexture1.png";

var loader = new GLTFLoader();
loader.load(
  GLTFObject,
  function (gltf) {
    var flat = gltf.scene.children[0]; //depends on 3D object
    flat.material.map = texture;
    scene.add(flat);
  },
  undefined,
  (error) => console.error(error)
);This project was bundled with Webpack. Scripts and config files are included below:
"build": "webpack --config=webpack.prod.js", //production build
"build-dev": "webpack --config=webpack.dev.js",
"start": "webpack-dev-server --open --config=webpack.dev.js" // development server- Alex Kuhn - my research project supervisor.
- That French Game Dev - learned a lot from his city generation algorithm he wrote back in 2014.
- Jihoon Ryoo - learned a lot about graph-related algorithms from his CSE373 course.

