Business/Data Analyst · Python & Power BI · LLM Evaluation
I build lean, reproducible data workflows: retrieve → clean → store → analyze → visualize.
Open to remote roles worldwide.
Mini-analysis of Eurobarometer 101.4 (2024) on AI in the workplace:
- Employer awareness of AI
- Use of AI for performance/sanctions
- Perception that AI improves safety
Stack: Python · Pandas · Matplotlib · Jupyter · Power BI
Repo: jdgomezza/ai-at-work-eurobarometer-2024
Dashboard (.pbix): powerbi/ai-at-work.pbix • README section
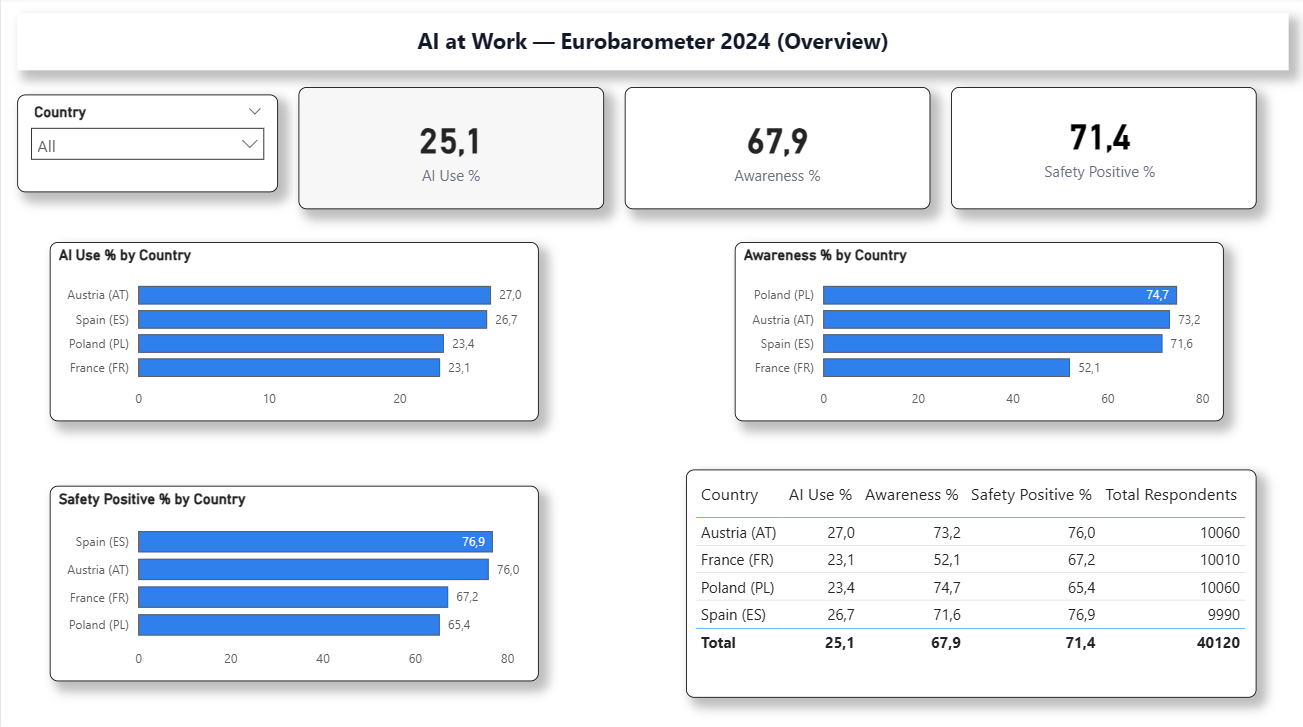
Outputs included: stacked bar charts + country highlights CSV (output/highlights.csv) and a Power BI overview.
Python · Pandas · NumPy · Jupyter · Matplotlib · SQL · SQLite · Power BI
- End-to-end data workflows with clean structure and docs
- Publication-ready charts that tell a clear story
- Lightweight LLM evaluation tooling (QA rubrics, consistency checks)
- New: Eurobarometer “AI at Work” analysis (see Featured project).
- Completed a mini capstone: job-posting snapshot → simple ETL (JSON → SQLite → CSV → Matplotlib).
- Leveling up with hands-on SQL, NumPy, and Pandas.
- ai-at-work-eurobarometer-2024 (completed) — survey analysis • stacked charts • Power BI overview
- job-skills-mini (completed) — JSON → SQL → CSV → chart
- market-pricing-monitor (coming soon) — price ingestion → SQLite → weekly deltas & anomaly flags
- llm-eval-mini (coming soon) — prompt sets, rubric scoring, simple metrics
- Small, composable scripts and notebooks:
01_retrieve.py→02_clean_store.py→03_analyze.py→04_visualize.py - Reproducibility first:
requirements.txt, deterministic outputs, clear READMEs - SQLite for persistence; Matplotlib/Power BI for final figures
- LinkedIn: https://www.linkedin.com/in/jdgomezza/