![]()
This is an R package for analyzing and visualizing data from Microsoft Workplace Analytics.
-
Run prebuilt analysis and visualizations off Workplace Analytics data with settings for HR variables, privacy threshold, etc.
-
Generate prebuilt interactive HTML reports, which cover specific areas e.g. collaboration, connectivity
-
Leverage advanced analytics functions, such as text mining and hierarchical clustering, which are built for Workplace Analytics metrics
-
Integrate analysis of Workplace Analytics data with your R workflow seamlessly
Here is an example of wpa in action:

You can install the GitHub version of wpa with the following in R:
# Check if devtools is installed, if not then install it
if(!"devtools" %in% installed.packages()){
  install.packages("devtools")
}
devtools::install_git(url = "https://github.com/microsoft/wpa.git")
Note that wpa is not yet released on CRAN, and therefore install.packages() will not work.
The package comes shipped with a sample Standard Query dataset (sq_data), so you can start exploring functions without having to read in any data. Most functions in wpa share a consistent API, and enable you to return results for both a plot or a table (data frame):
collaboration_sum(sq_data, return = "plot")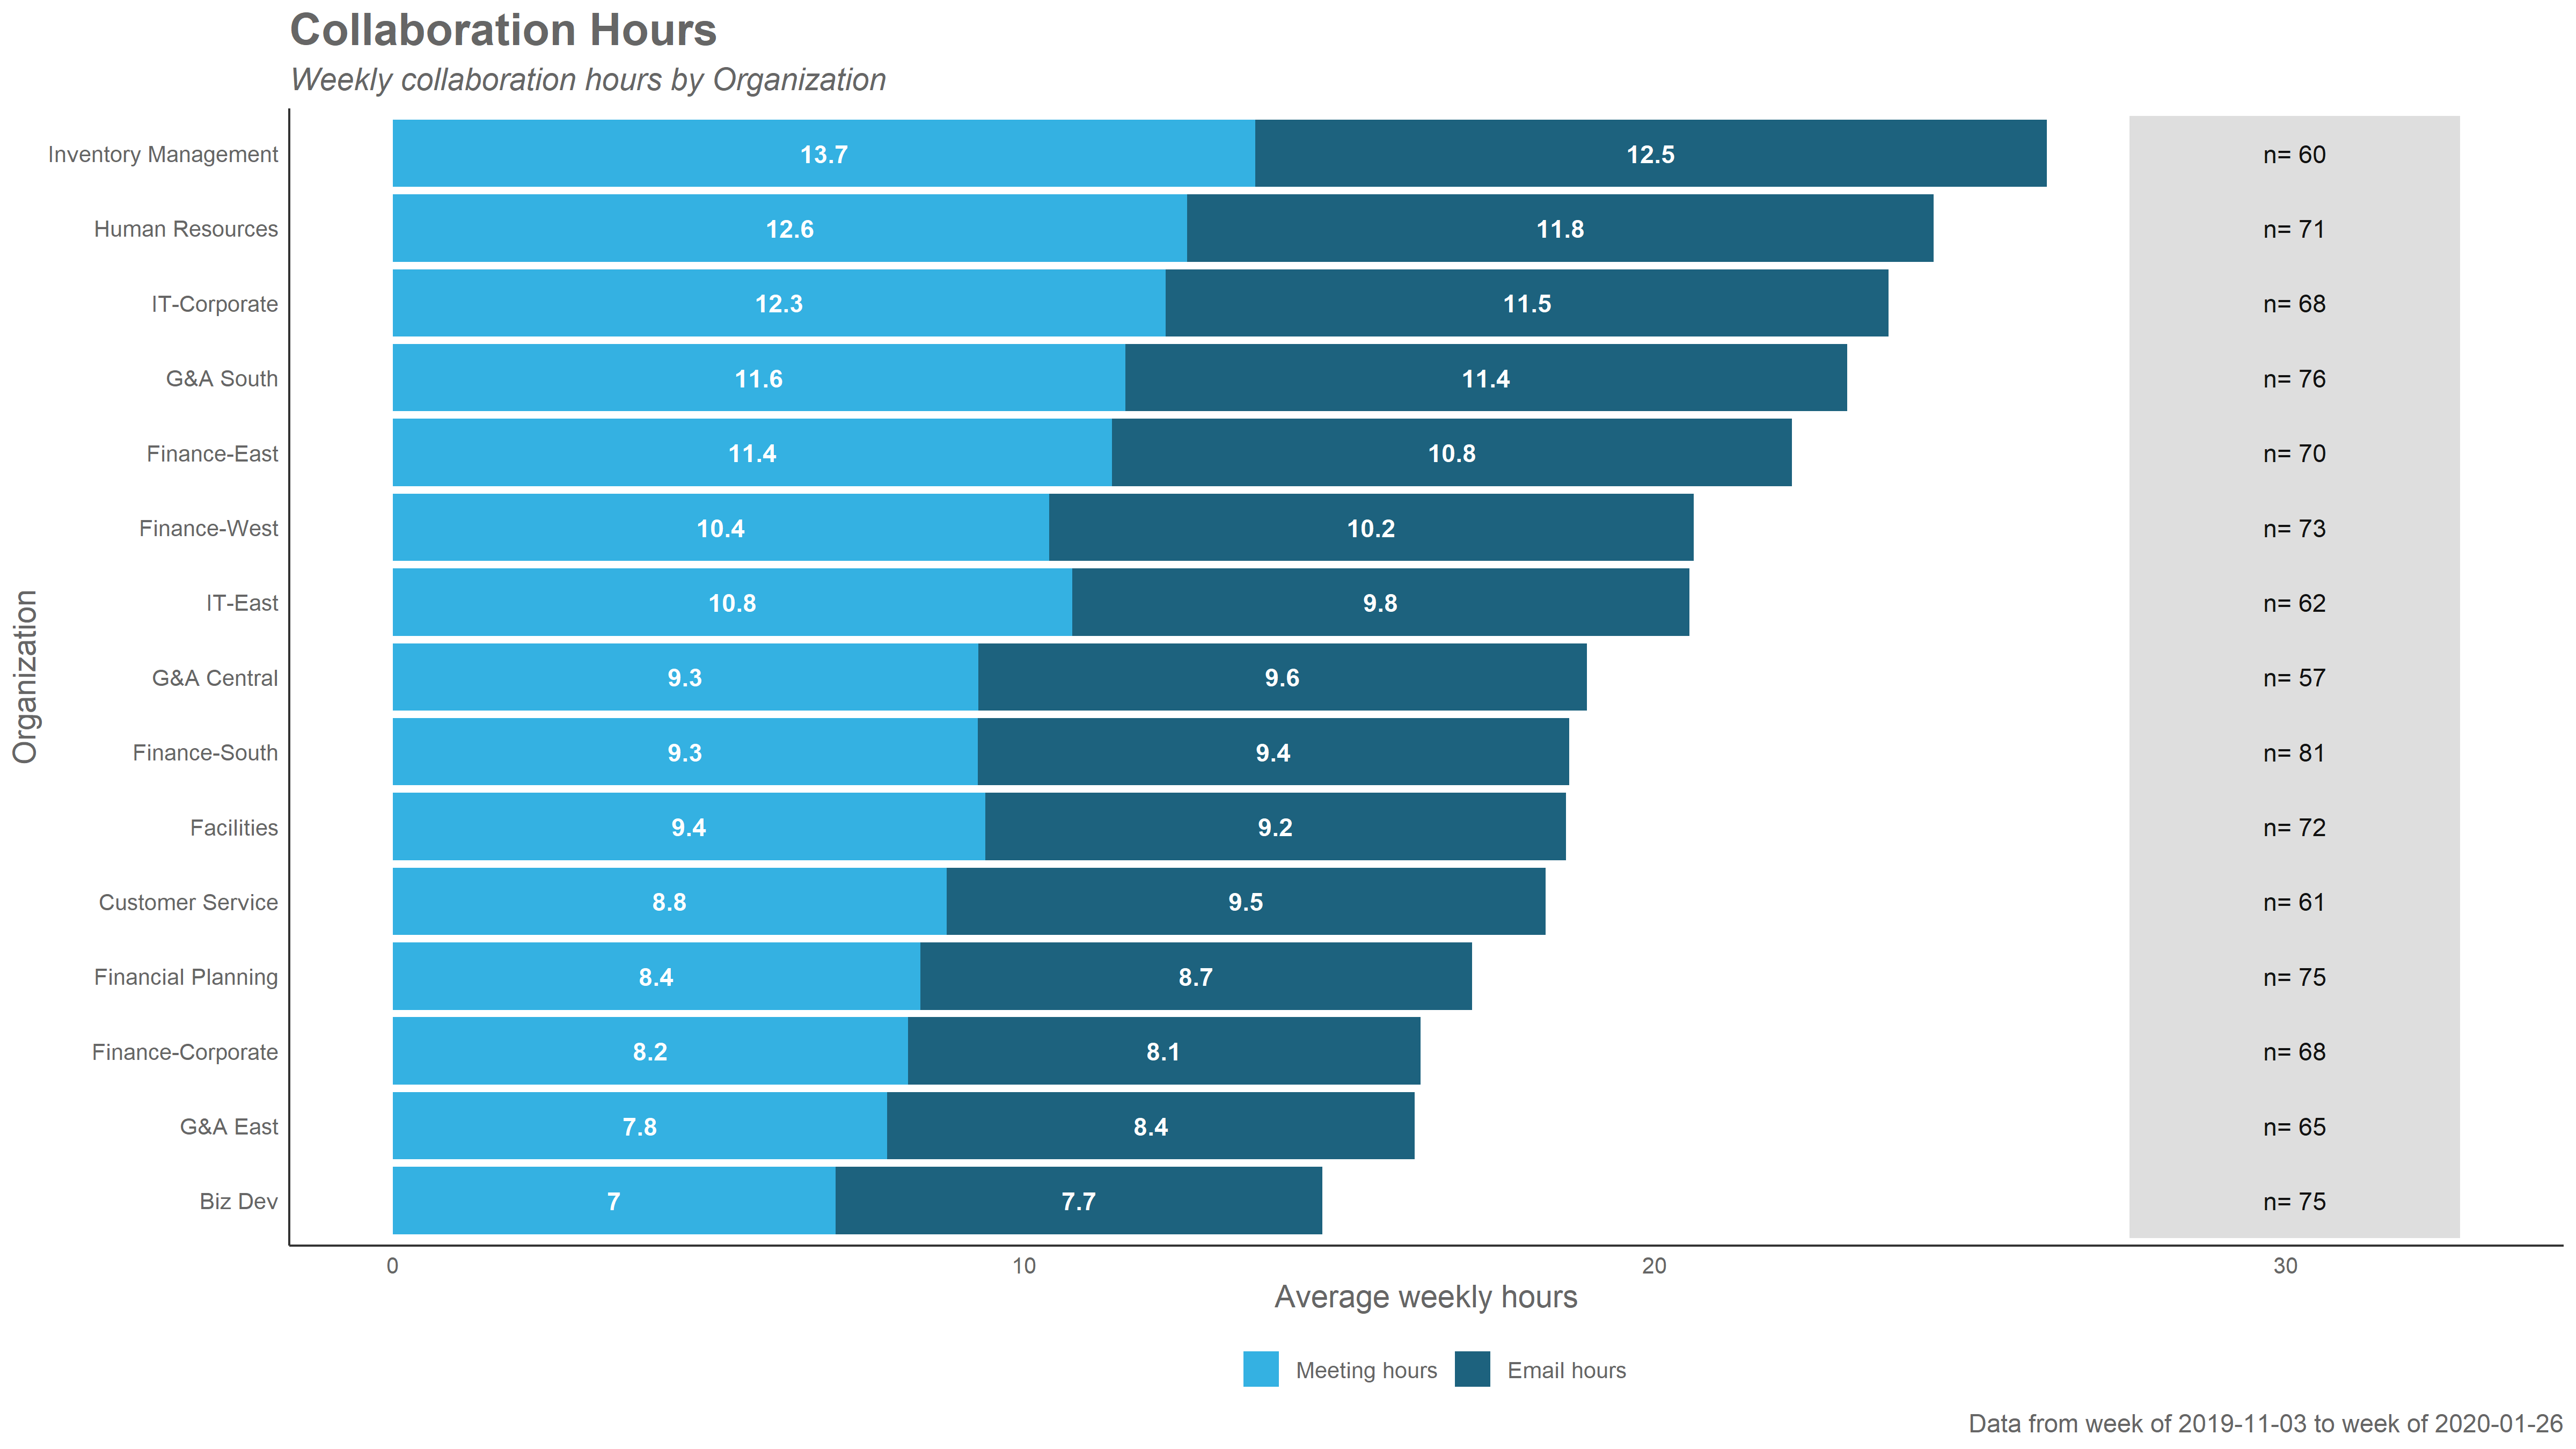
By passing 'table' to the return argument, the function will return a data frame with the relevant summary statistics.
The following illustrates the basic API of standard analysis functions:

For information on the package structure, please see the relevant section in our Analyst Guide.
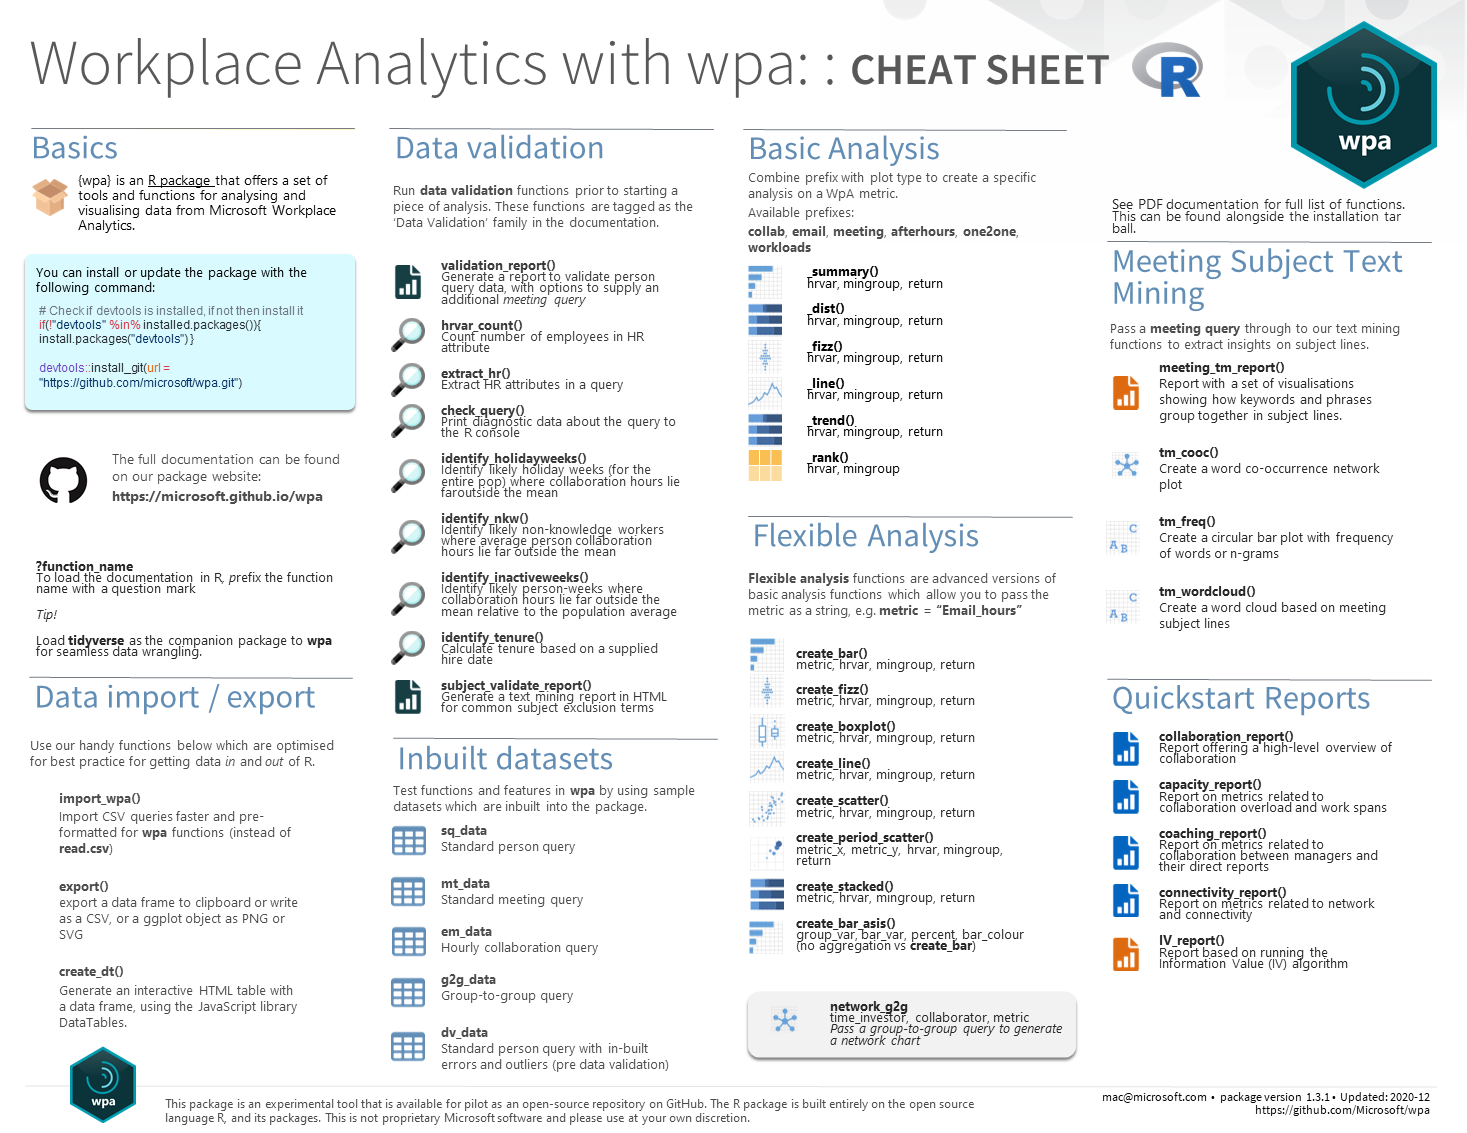
Also check out our package cheat sheet for more information:
You can browse the vignette by running the following in R:
vignette(topic = "intro-to-wpa", package = "wpa")We welcome contributions to the package!
If you would like contribute code to the repo, please read our Contributor Guide and Developer Guide. This documentation should provide you all the information you will need to get started.
If you would like to log an issue or submit a feature request, please create a new issue or comment on an existing issue on GitHub Issues on this repo.
Please do not report security vulnerabilities through public GitHub issues. Please read our Security document for more details.
See NEWS.md for the package changelog.
We would ask you to please read the Microsoft Open Source Code of Conduct prior to engaging with this package.
Trademarks
This project may contain trademarks or logos for projects, products, or services. Authorized use of Microsoft trademarks or logos is subject to and must follow Microsoft's Trademark & Brand Guidelines. Use of Microsoft trademarks or logos in modified versions of this project must not cause confusion or imply Microsoft sponsorship. Any use of third-party trademarks or logos are subject to those third-party's policies.
⭐ Please star this repository to keep us going!
Contributors to the GitHub repo:

See full list here.