- Personal Backstory of This Project
- Dataset Description
- Purpose & Practical Applications
- My Approach
- Explanation
- Learnings
After finishing a few basic courses on NLP and Naive Bayes, I was looking for a text dataset to try out my newfound skills, when I came across this dataset on Kaggle. I tried it out in a Kaggle notebook itself (around May 2023), and moved on (but, not really). As I kept on learning new techniques and even about Transformers, I kept thinking back to this (relatively) simplistic notebook - I kept wondering what else could I have done better with this dataset. By September, I finally decided to plunge back into it with a more comprehensive approach this time with the challenge of improving accuracy on this dataset. But, it wasn't time yet - my personal life went topsy-turvy, and my routine went for a toss. I was still learning, but mostly from books - away from my laptop. Still, I had to finish this - I finally came back to this in February 2024, Deep Learning with Python (by Francois Chollet)'s thumb rule on which text dataset would do better with Deep Learning forced me to check out this dataset (I will save you the suspense, this dataset should perform better with non-DL models). I finally managed to restart (from scratch) and after spending 1.5-2 months more on this, here is the final result. I did manage to improve the score a little, still managed to learn quite a few new things, somewhere back in my mind I probably still want to try a few more tricks - but enough is enough, I need a break from this project. 😄
The dataset consists of 2 csv files containing tweets mostly about Football (and that too, mostly about the Egyptian League) - fake.csv contains all the fake tweets, and the real tweets are in real.csv.
I'll be honest here - my sole purpose for this project was to see how far can I take the model from where I started, and I don't see a lot of real world practical application for this particular model. Let me clarify.
As I already mentioned, my first model on this dataset was pretty basic - but it still managed to achieve 94% accuracy. I wanted to see what else I can do to fetch even more relevant information from the dataset (and as a measure, how much Accuracy can I glean). And that is the reason why I spent most of my time in preprocessing, trying to ascertain that all the possible information from the text has been captured by the processed numerical data.
The dataset is a collection of tweets related to Football, most closely associated with Egyptian Premier League. The model trained on this dataset, can only be utilized on tweets on the same topic. Also, text classification gets outdated very quickly, and since this dataset is quite dated at this point - I fail to see how this particular model can have any practical usefulness. Why did I still do it then? While the model may not generalize for other text formats, the steps followed in cleaning and processing the data will generalize very well for any other (English) text. Also, the classification algorithms used, the various techniques used in Hyperparameter tuning those algorithms etc. are universal. So, I am satisfied with my effort spent on this project, I have learned quite a lot.
- The dataset was well-balanced across Real and Fake classes, so decided to use Accuracy as measure of a good model.
- Removed null, duplicate tweets first.
- For Tokenization, removed punctuation & stop-words, and then used lemmatization. Later while exploring, found some issues with how punctuation was removed directly - had to re-do this tokenization process (instead of removing punctuation, I replaced them with space).
- However, punctuation and stop-words data was not dropped altogether - that and some other information from the data was quantified (mostly by character count) and used as new features.
- These new numerical features were evaluated (via visualization) on whether the class distinction is clearly visible in their distribution - based on that decided which ones to use. One of the features (length of tweets, after removing punctuation) required transformation, others were scaled.
- Finally, it was time for the vectorization of the word tokens. In the previous Kaggle notebook I had tried TF-IDF, Count, and N-grams Vectorizers and found results of TF-IDF and Count Vectorizers to be comparable (results of N-grams was a little worse). Inspired by Deep Learning approaches, I wanted to see whether word embeddings can provide better results. I used Gensim Word2Vec to generate the word embeddings, however the results didn't look very promising - the notebooks can be found here.
- I decided to use a different Vectorization approach this time. My first decision was to limit the number of features to 35 thousands, since that would maintain balance between number of samples (around 35 thousands for train set) and number of features. I would lose some information due to this, to counteract that I decided to use a combination of TF-IDF and N-grams (unigram, bigram and trigram). I can see that this is not shown in the final notebook, so providing this information here - this approach meant that my final dataset contained 7433 unigrams, 17396 bigrams, and 10171 trigrams.
- The data was ready now - I had scaled (and modified) numerical features and word vectors, but faced issues while trying to join them. So far, I had mainly worked with pandas dataframes. But while my numerical features were in numpy array, my word vector was in sparse matrix format. I tried to convert the sparse matrix into a dataframe and then combine them into one, but due to the size of the sparse matrix - my machine ran out of memory during that operation every time. After quite a lot of research (had to ensure that I can save the data as well, discussed in the next point) - I decided to go the other way, and merged everything in two separate (training & test) sparse matrices itself.
- Now that I had my dataset in its final form, since I could not perform all the operations I planned on it in a single notebook, it was time to save the data. The dataset was two sparse matrices (training & test), and I managed to save them in two npz files by adding specific information of the sparse matrices (specifically - the indices, index pointer, and shape, other than the data) separately. When I was searching the method for that online, I didn't find a direct answer - my approach was an amalgamation of various information I found from different sources.
- First ML model I applied on this dataset was the Multinomial Naive Bayes, since that was the one I had used in my Kaggle notebook, and this was literally my baseline (since I wanted to improve upon this).
- After this, one-by-one I trained, and hyperparameter-tuned on the training set, and finally tested (on the test set) various classification methods - Logistic Regression, Random Forest, Gradient Boosting, XGBoost, and SVM respectively.
- For Hyperparameter tuning, I was initially using Grid Search - but, found it too time-consuming. So, I found Bayesian Optimization as a valid alternative, and much faster (required lesser number of test runs to zero in on the best parameters).
- After finding my best models for each classification algorithm, I also decided to try a couple of ensemble models - Voting Classifier and Stacking Classifier, with these best models (one of each) as base models for these ensemble models. I tried several combinations, but the performance gain was very nominal - 0.962 to 0.963. I finally decided to opt for the single algorithm model (as opposed to ensemble model), due to the manifold increase in the complexity of the final model.
Our tweets' dataset contains almost equal number of fake and real tweets, the dataset derived from it (which is what machine learning models actually use) is numerical in nature. We cleaned the tweets of punctuation, stop words (common words like 'the', 'and' etc., which although are required for sentence structure, don't contribute anything to the central message). Apart from 3 basic numerical features (like length of the tweet etc.), the rest of the features are extracted by something called Term Frequency - Inverse Document Frequency (TF-IDF) of records. TF-IDF basically tells us how 'important' a word (Term) is for a given document (in this case, each tweet is a document), in context of all documents. For instance (completely imaginary examples), a word (like - Football) that appears in 90% of all the tweets does not convey any special meaning. But consider another word (like - Mourinho) that appears twice in the current tweet and in total there are only 5 tweets that mention him (José Mourinho is a football manager, very famous) - in this context, Mourinho is significantly more meaningful. Here we considered a combination of all 1, 2, and 3 consecutive words (after removing punctuation, stop-words etc. - as already mentioned) as term, and took top (having more TF-IDF weight) 35000 of them in our dataset.
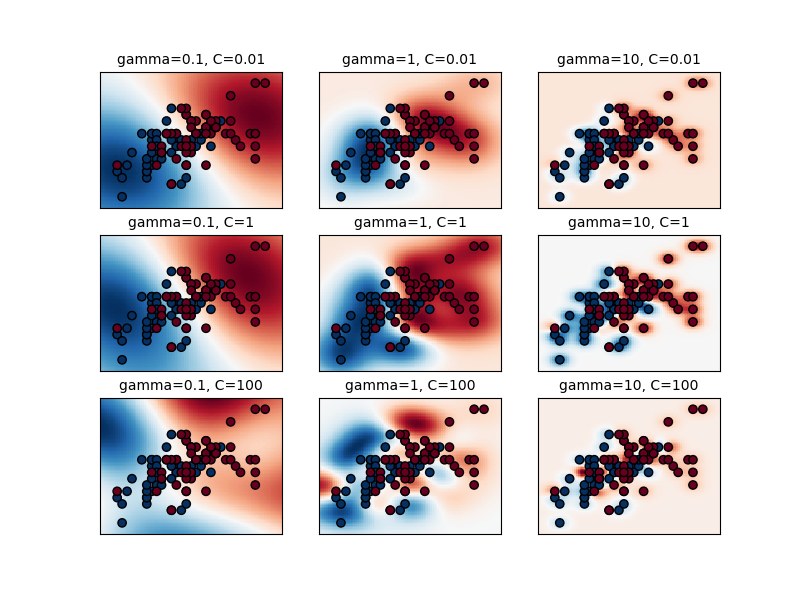
Talking about our model, the model that performed best on our dataset is Support Vector Machine (SVM) - it's not surprising, since SVM-s have a reputation of being particularly good for Binary Classification (like Real or Fake tweet in our situation), and Text Classification. SVM basically takes the dataset to a higher dimension (queue your favorite science fiction music), where the classes become linearly (through a line, or a plane etc.) separable. Now, it is not possible to visualize this separation for our dataset, since we used Radial Basis Function (rbf) kernel, which literally takes the data to an infinite dimension. However, to gain an idea, you can look at this plot from scikit-learn (for a much simpler dataset, our parameters somewhat match the image at the middle in the bottom row) :
- Gained extensive Cross Validation experience with Grid Search and Bayesian Optimization. Had also played with Random Search and Parameter Grid (just iterating through the parameters, implemented Cross Validation like function from scratch) - although, final version of the notebooks don't include those codes.
- Had no experience with these, used for the first time (to various effects) - learned a lot :
- XGBoost
- Ensemble methods (like Voting Classifier and Stacking Classifier) with a lot of options
- Positional Embedding, with Word2Vec (on a very basic level)
- Also, Bayesian Optimization
- Learned how to save sparse matrix in npz format.