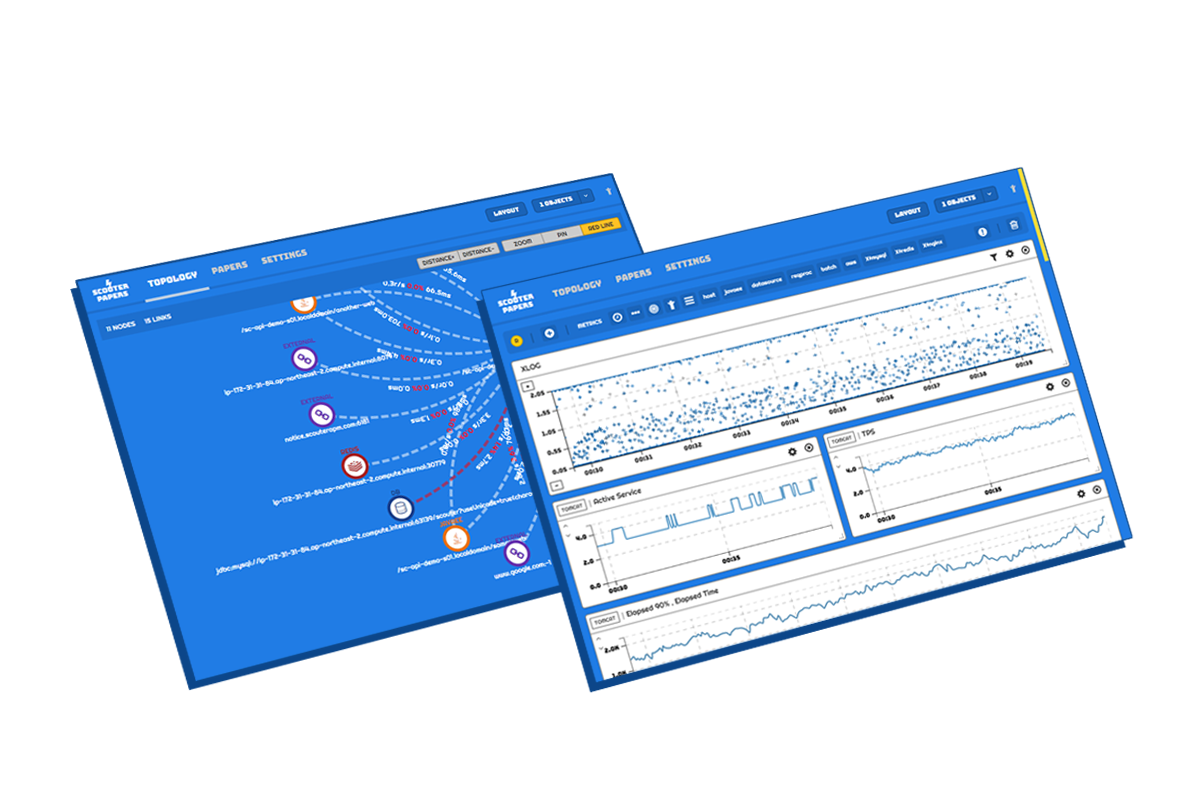
SCOUTER is an open source APM like new relic and appdynamics. (APM means application performance monitoring or application performance management.)
-
Monitoring targets (from scouter agent)
- Java Agent : Web application (on Tomcat, JBoss, Resin ...), Standalone java application
- Host Agent : Linux, Windows, Unix
-
Monitoring targets (from Telegraf support) Since @2.0.0
- Redis, nginX, apache httpd, haproxy, Kafka, MySQL, MongoDB, RabbitMQ, ElasticSearch, Kube, Mesos ...
-
Monitoring targets (from Zipkin-Scouter storage) Since @2.5.0
- Any zipkin instrumentations(C#, Go, Python, Javascript, PHP...) can be shown in a XLog(Scatter) chart.
- see the zipkin-scouter-storage documentation.
- see the zipkin instrumentations.
Users use application services on a system and the services use resources on the system. You should understand this context in order to manage the system performance efficiently. SCOUTER can help you.
- SCOUTER shows
- Metrics about users : Active user, Recently used user, Today visitor
- Metrics about services : Active service, TPS, Response time, Application profiles(method profile, sql profile, external call profile...)
- Metrics about resources : Cpu, Memory, Network and Heap usage, Connection pools etc.
- Document home
- Quick start guide (Quick Installation of demo system)
- Installation
- Live demo
- How to analyze XLog View
- Customizable alarm - Alert plugins guide
- Telegraf server feature
- Client screen help
-
Agent : gather performance information and send to the server
- Java Agent (JVM Agent) : gathering profiles and performance metrics of JVM & Web application server(eg. Tomcat)...
- Host Agent (OS Agent) : gathering performance metrics of Linux, Windows and OSX...
- MariaDB Agent : [to be announced]
-
Server (Collector) : save the performance metrics from scouter agents or telegraf. The data is streamed to scouter client.
-
Client (Viewer) : client program based on RCP. (not support OSX Big Sur.)
-
Web API (Since @1.8.0) : scouter web apis to get counters, XLogs, profiles and another performance metrics via HTTP protocol.
-
Weaver (Since @2.17.0) : Provides the ability to directly control Scouter XLog and Profiles at the code level of Java applications.
- scouter paper : scouter paper homepage
- showcase : scouter paper overview (youtube)
- showcase : scouter paper overview (youtube)
-
Server plugin
-
Sample
- scouter-plugin-server-null : sample plugin prints out data collected
-
Alert
- scouter-plugin-server-email : emails alerts from Scouter
- scouter-plugin-server-telegram : transfer alerts from Scouter to telegram
- scouter-plugin-server-slack : transfer alerts from Scouter to slack
- scouter-plugin-server-line : transfer alerts from Scouter to line
- scouter-plugin-server-dingtalk : transfer alerts from Scouter to dingtalk
-
Counter
- scouter-plugin-server-influxdb : transfer performance data from Scouter to influxDB(time series DB)
-
-
Agent plugin
- TBD
- Pulse type agent : scouter-pulse-library
- aws-monitor : gathering performance metrics of EC2, RDS, ELB from cloudwatch in AWS.
- Notice : Pull request to develop branch only allowed.
- Refer to the development guide below.
- Please note that you will have to complete a CLA for your first pull-request.
- Scouter series #1 - Installation
- Scouter series #2 - basic monitoring(1/2)
- Scouter series #2.1 - basic monitoring(2/2)
- Scouter series #3 - Active service & XLog
- Scouter series #4 - XLog details
- Scouter series #5 - Customizable alert
- Applying Scouter APM to my service : by Kingbbode
- Effective monitoring by Scouter : by TMON
- Opensource performance monitoring, Scouter configurations : by SUN
- Scouter, InfluxDB, Grafana
- Build my own agents by scouter pulse
- Quick installation of scouter paper UI
Licensed under the Apache License, Version 2.0


