Sankey diagrams in SwiftUI, powered by Google Charts‡
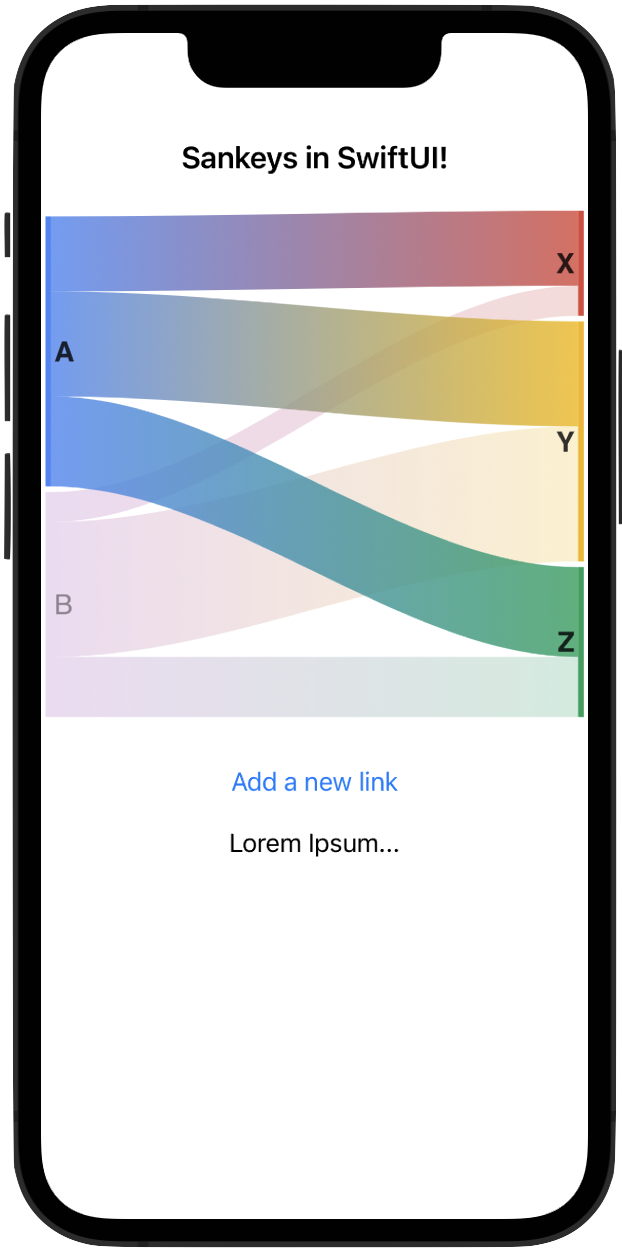
Make interactive charts like this:
With code as simple as this:
import Sankey
import SwiftUI

struct ReadMeView: View {
    // Create some data
    @State var data: [SankeyLink] = [
        // Option A: ExpressibleByArrayLiteral
        ["A", "X", "5"],
        ["A", "Y", "7"],
        ["A", "Z", "6"],
        ["B", "X", "2"],
        ["B", "Y", "9"],
        ["B", "Z", "4"]
    ]

    var body: some View {
        GeometryReader { geo in
            VStack(spacing: 20) {
                Text("Sankeys in SwiftUI!")
                    .font(.title3.bold())
                    .padding(.top, 20)
                // Native SwiftUI Component
                SankeyDiagram(
                    data,
                    nodeLabelFontSize: 50,
                    nodeInteractivity: true,
                    linkColorMode: .gradient,
                    tooltipTextFontSize: 50
                )
                // Will take up full View, unless you constrain it...
                .frame(height: geo.size.height * 0.5)
                Button {
                    data.append(
                        // Option B: Struct
                        SankeyLink(source: "C", target: "X", value: 3)
                    )
                } label: {
                    Text("Add a new link")
                }
                Text("Lorem Ipsum...")
            }
        }
    }
}Inspired by the examples in the Google Charts Gallery
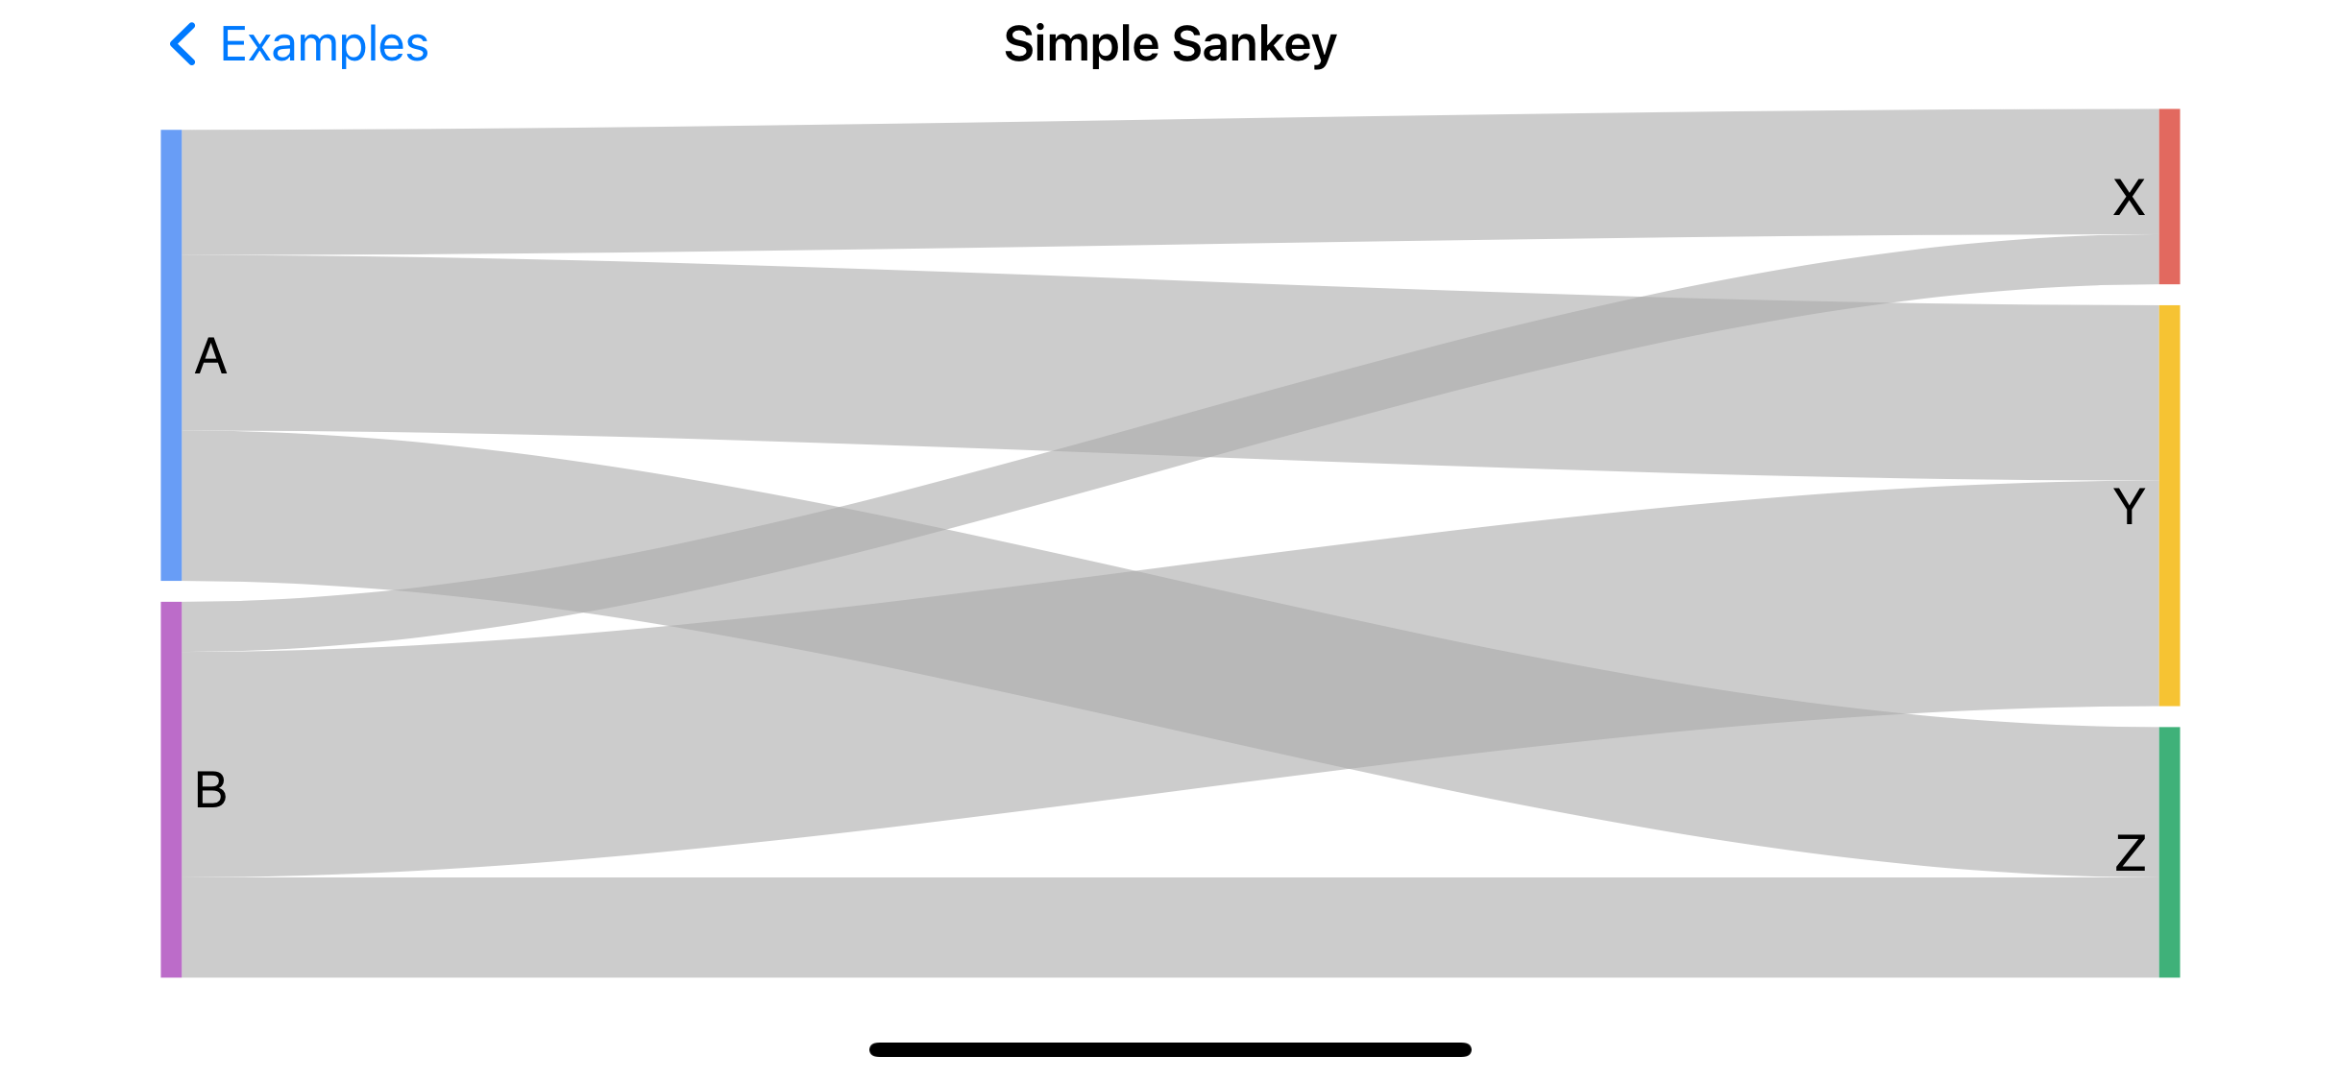
- Simple Sankey | Code | Inspiration
SankeyDiagram([
    ["A", "X", "5"],
    ["A", "Y", "7"],
    ["A", "Z", "6"],
    ["B", "X", "2"],
    ["B", "Y", "9"],
    ["B", "Z", "4"]
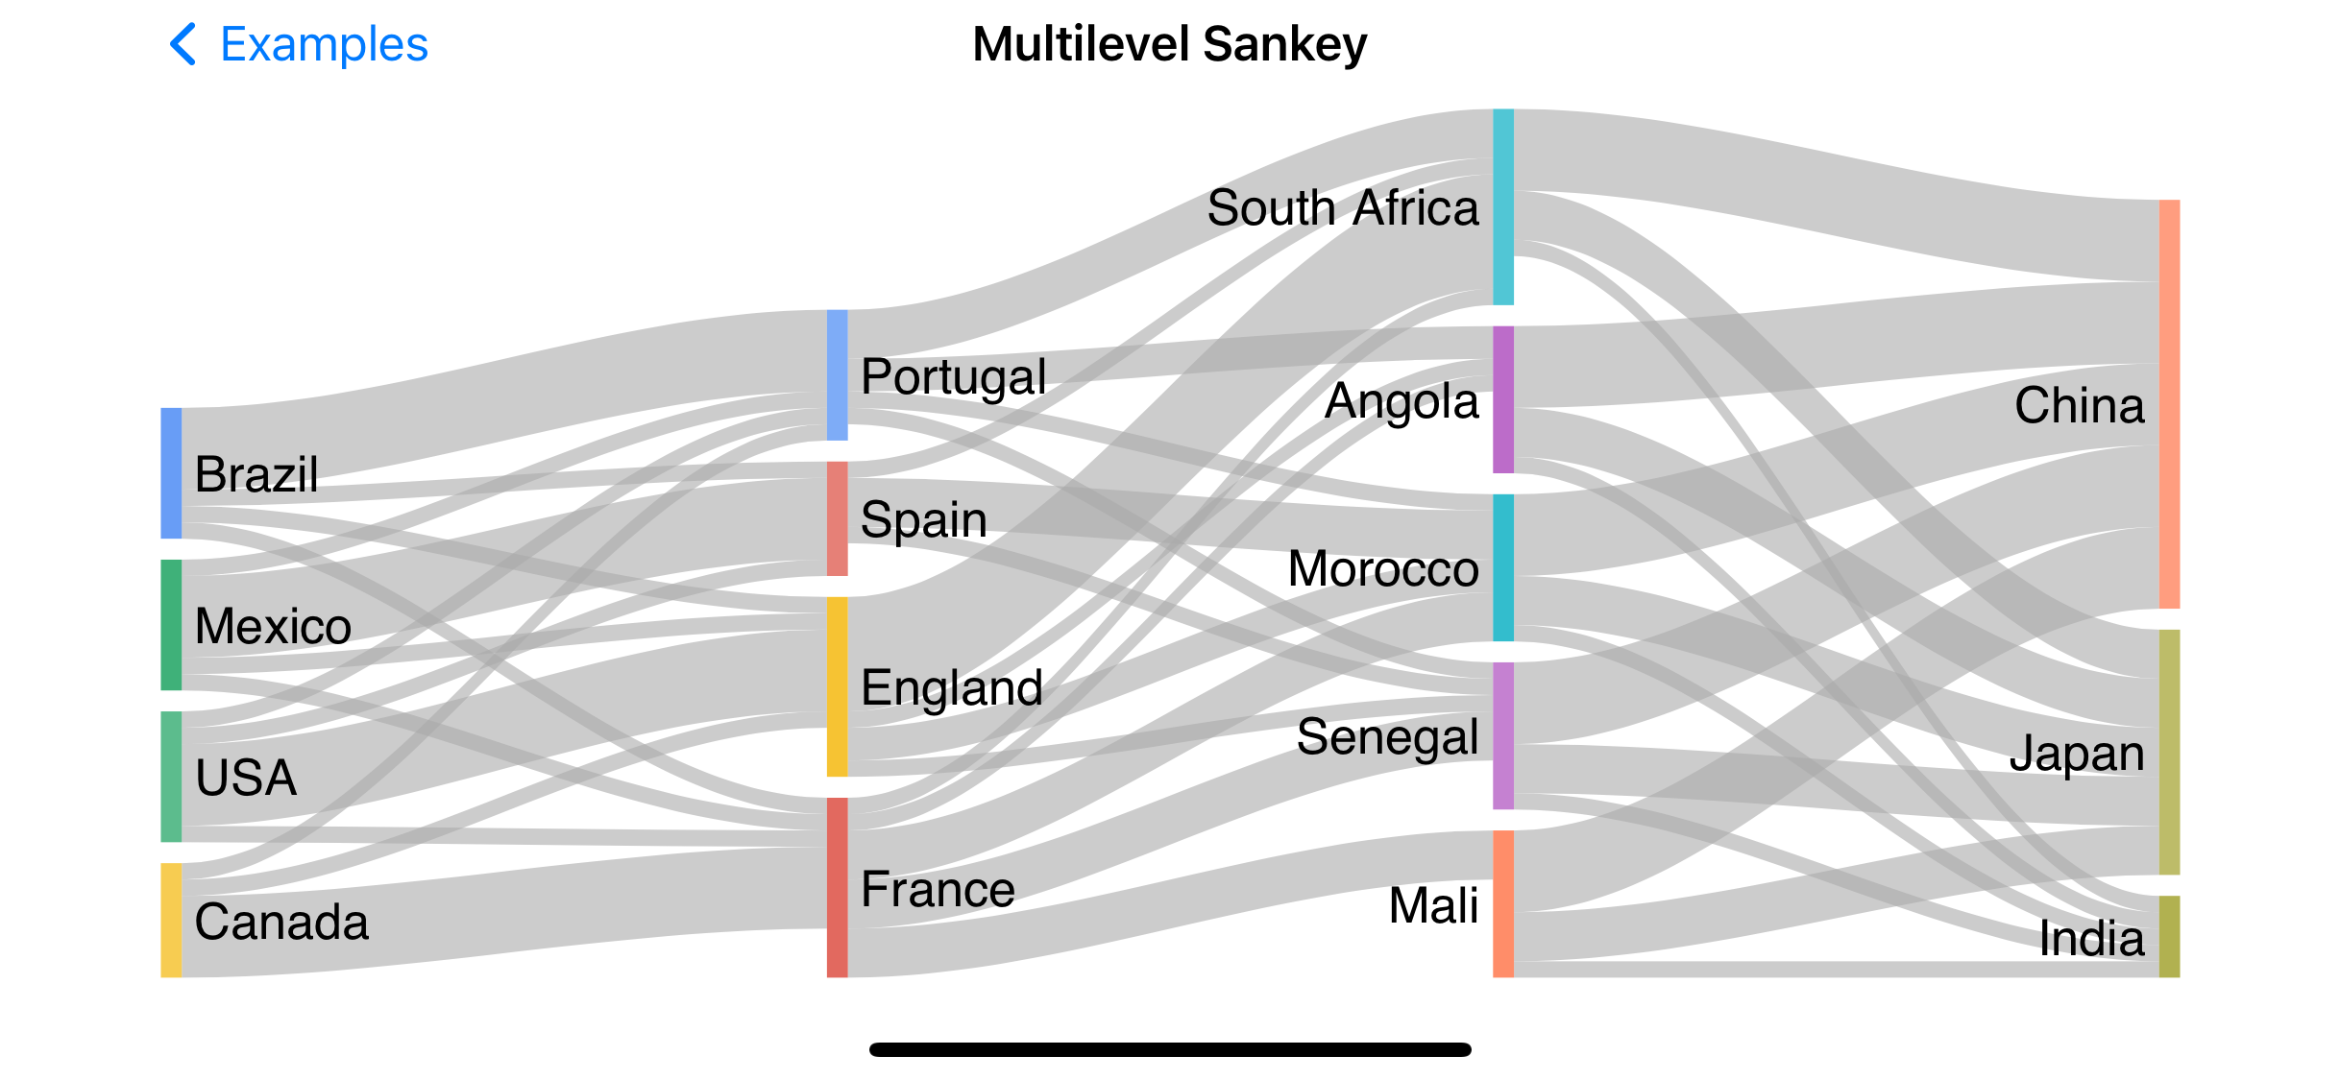
])- Multilevel Sankey | Code | Inspiration
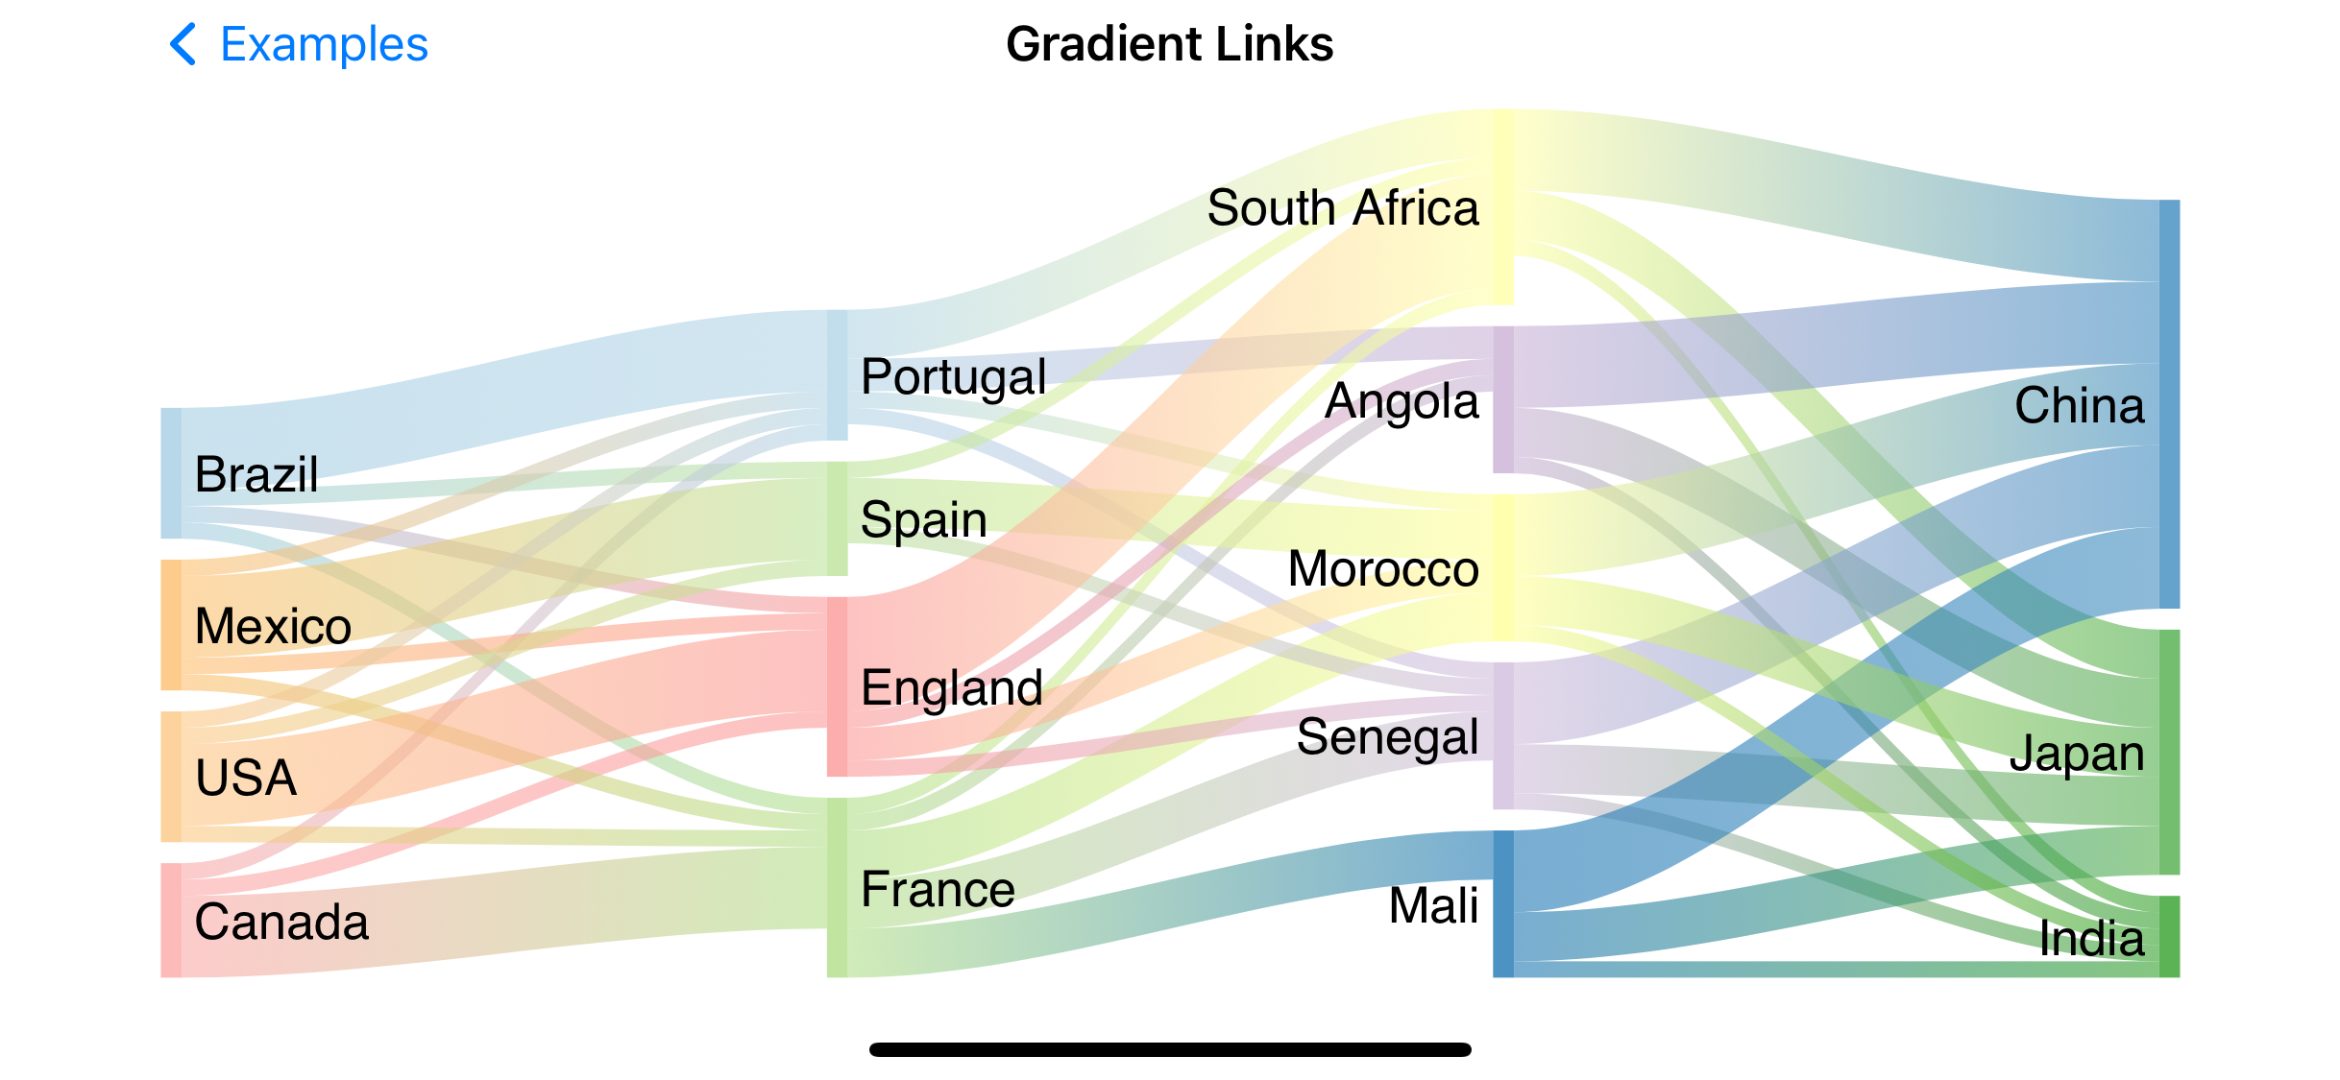
SankeyDiagram(data)- Gradient Links | Code | Inspiration
let colors = [
    "#a6cee3", "#b2df8a", "#fb9a99", "#fdbf6f",
    "#cab2d6", "#ffff99", "#1f78b4", "#33a02c"
]

SankeyDiagram(
    data,
    nodeColors: colors,
    linkColors: colors,
    linkColorMode: .gradient
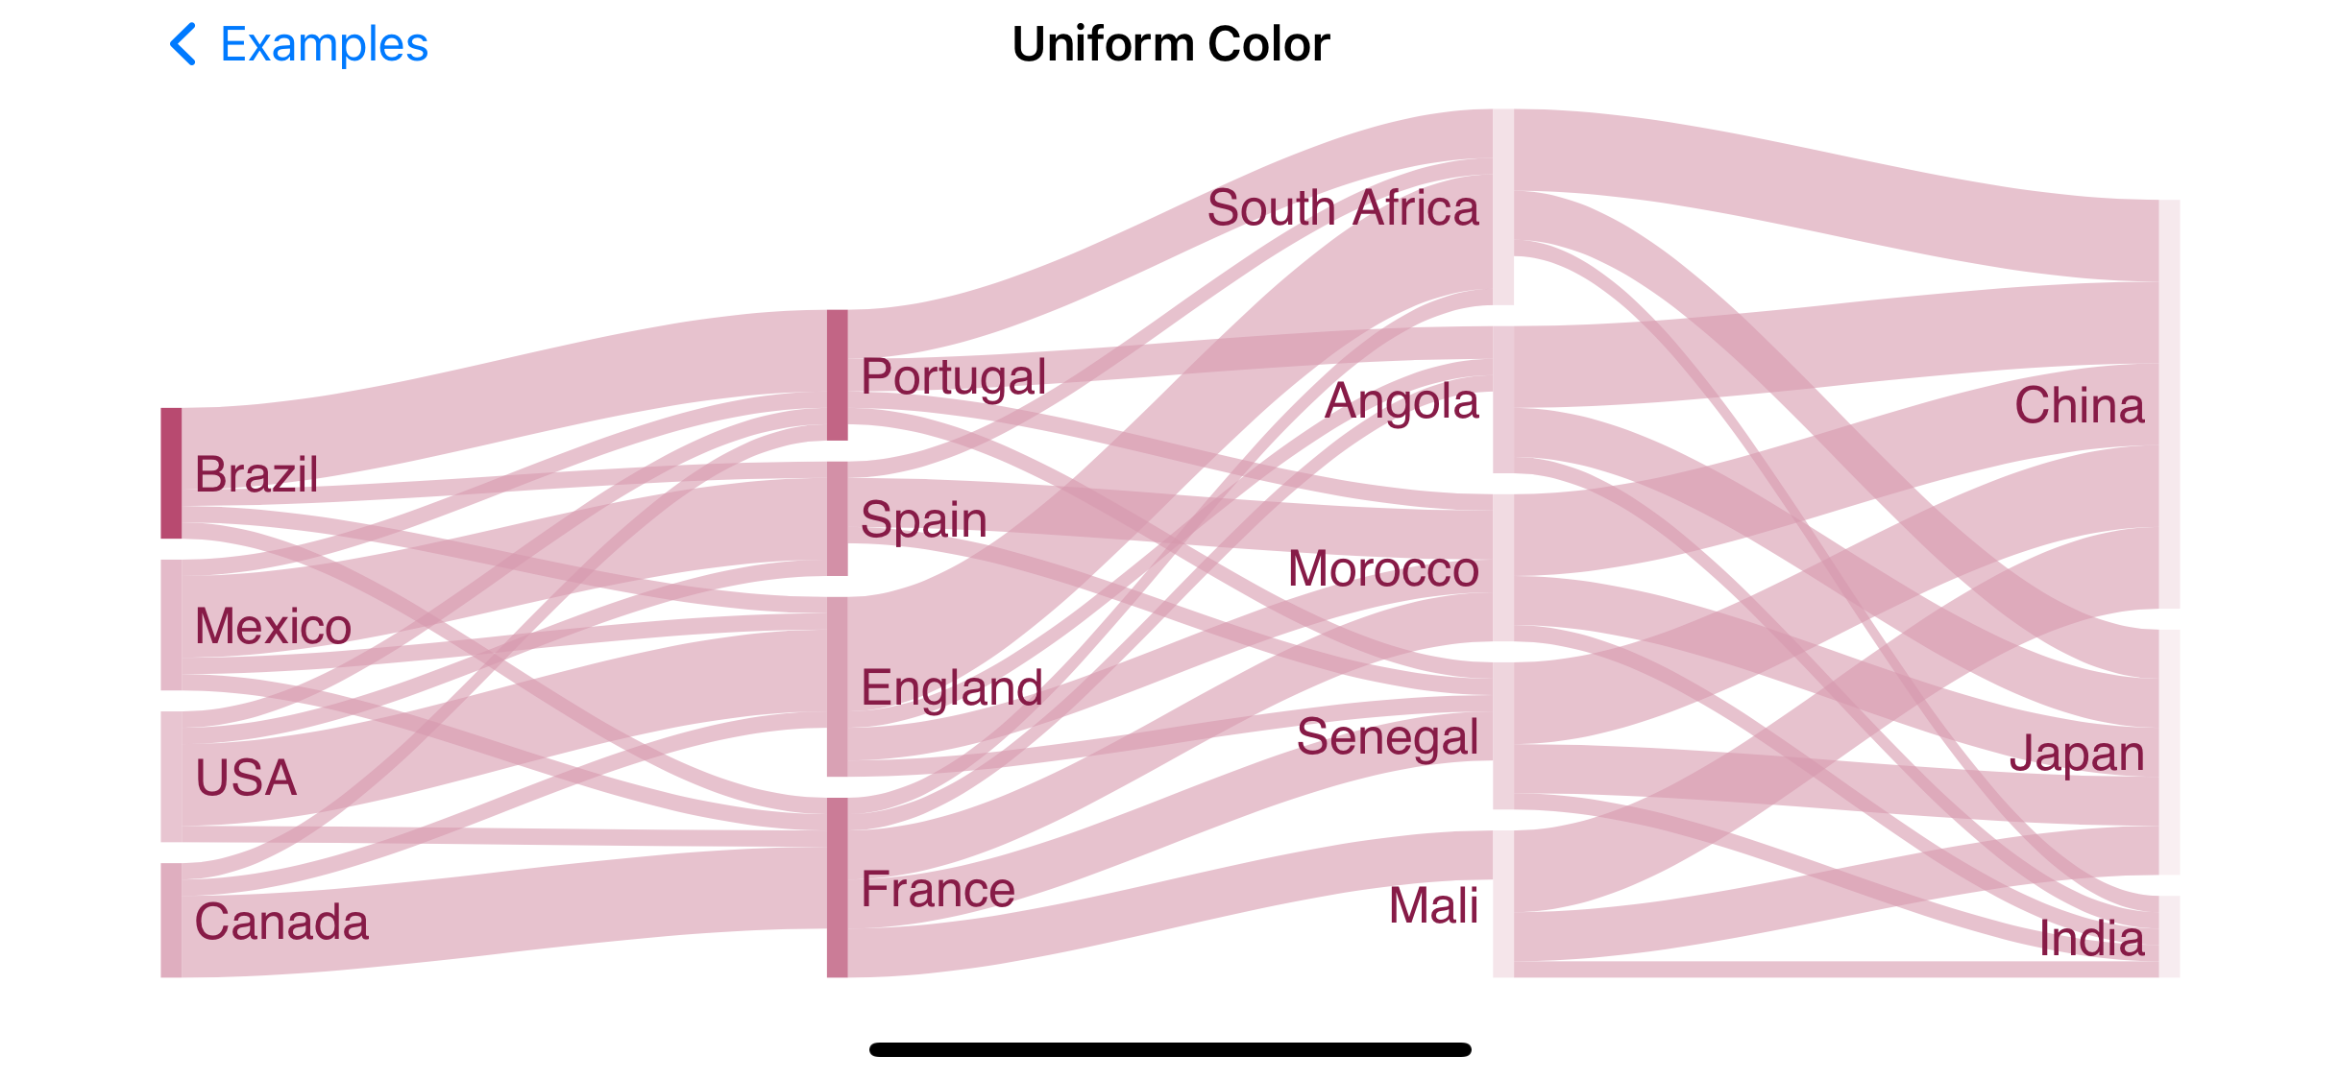
)- Uniform Color | Code | Inspiration
SankeyDiagram(
    data,
    nodeColors: ["#a61d4c"],
    nodeLabelColor: "#871b47",
    linkColorFill: "#d799ae",
    linkColorFillOpacity: 0.8
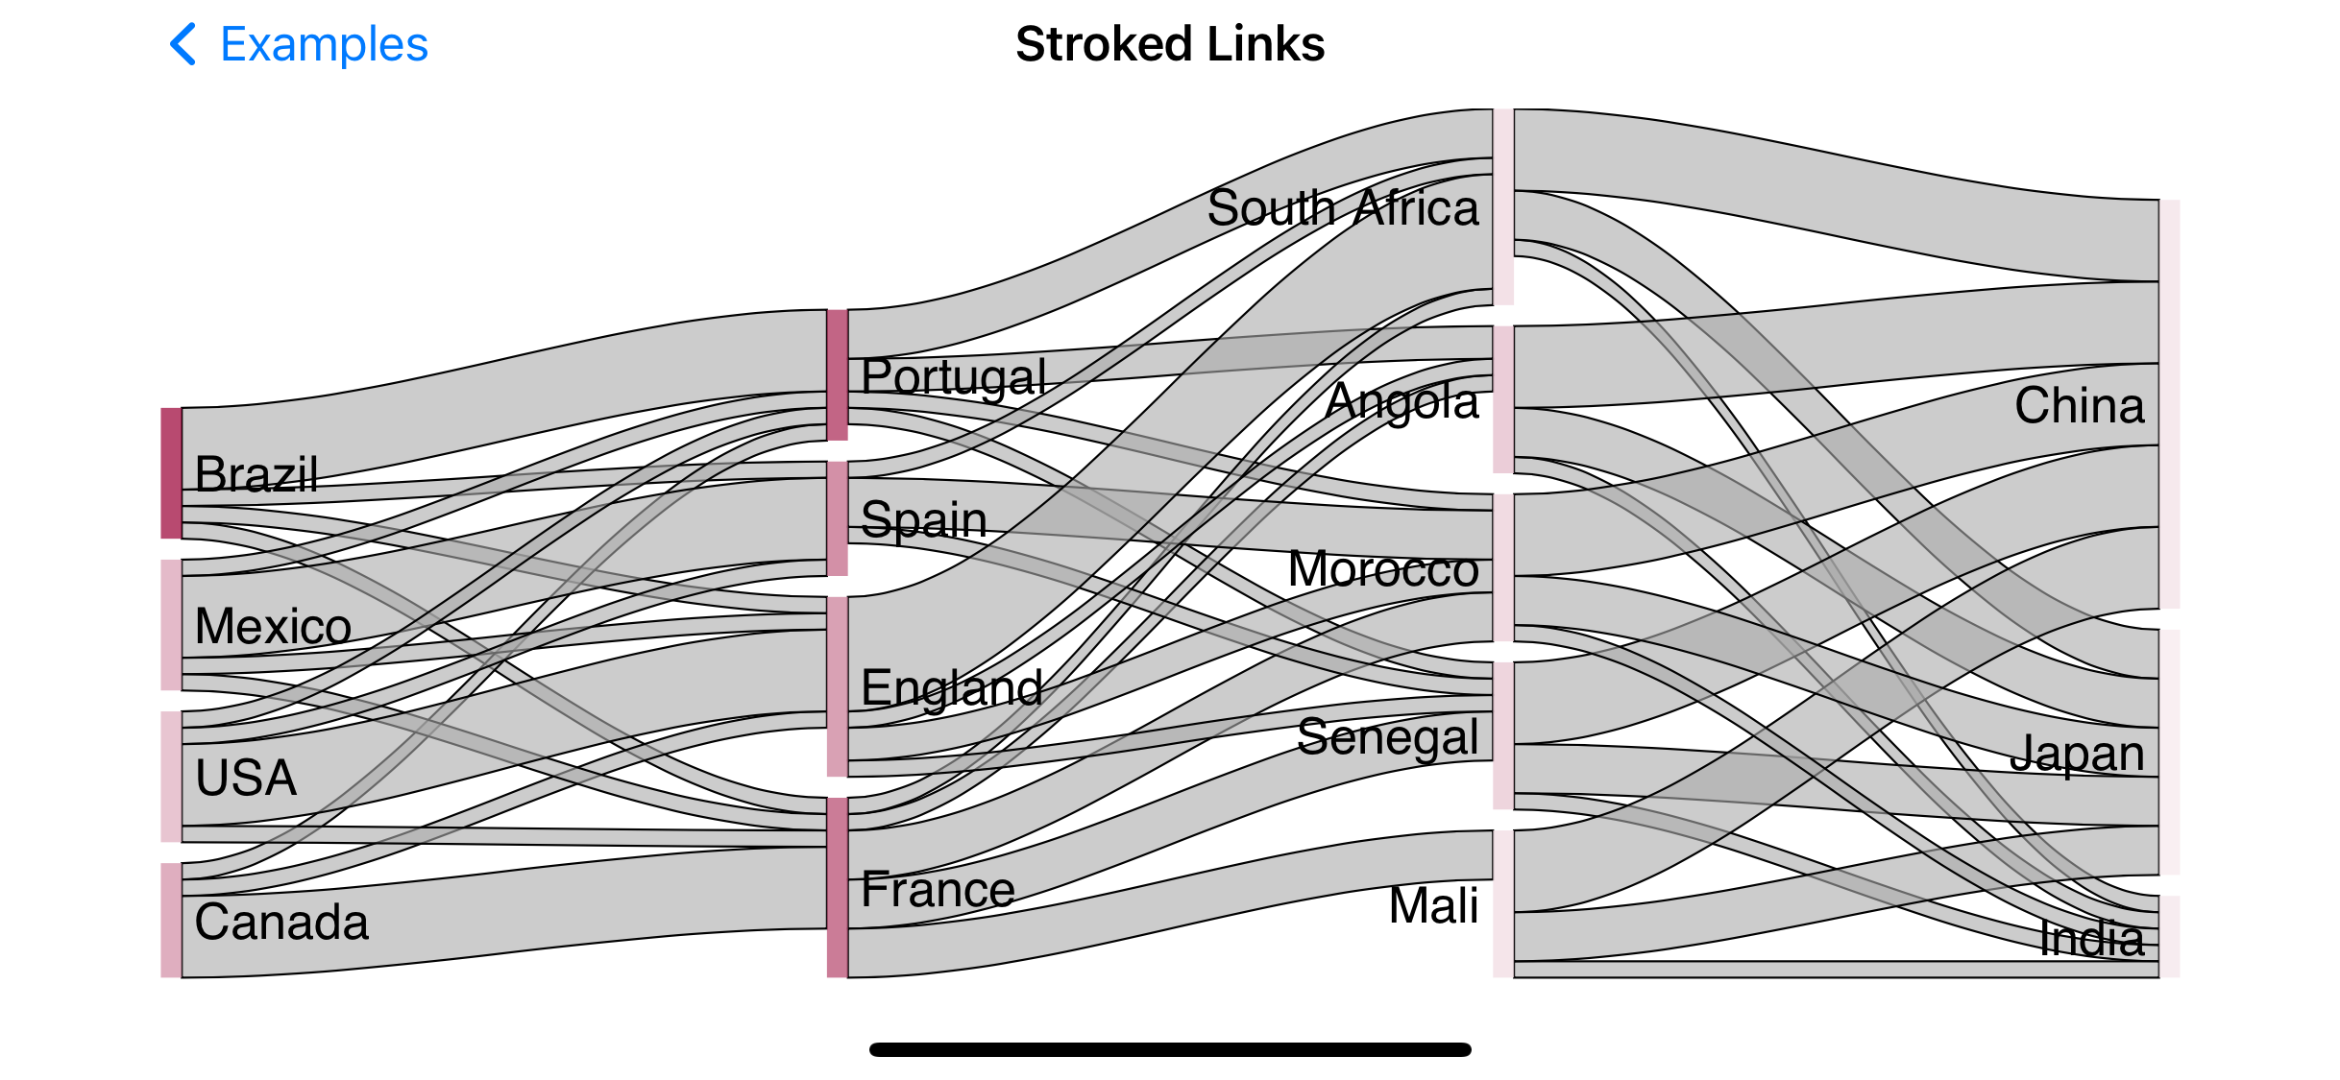
)- Stroked Links | Code | Inspiration
SankeyDiagram(
    data,
    nodeColors: ["#a61d4c"],
    linkColorStroke: "black",
    linkColorStrokeWidth: 1
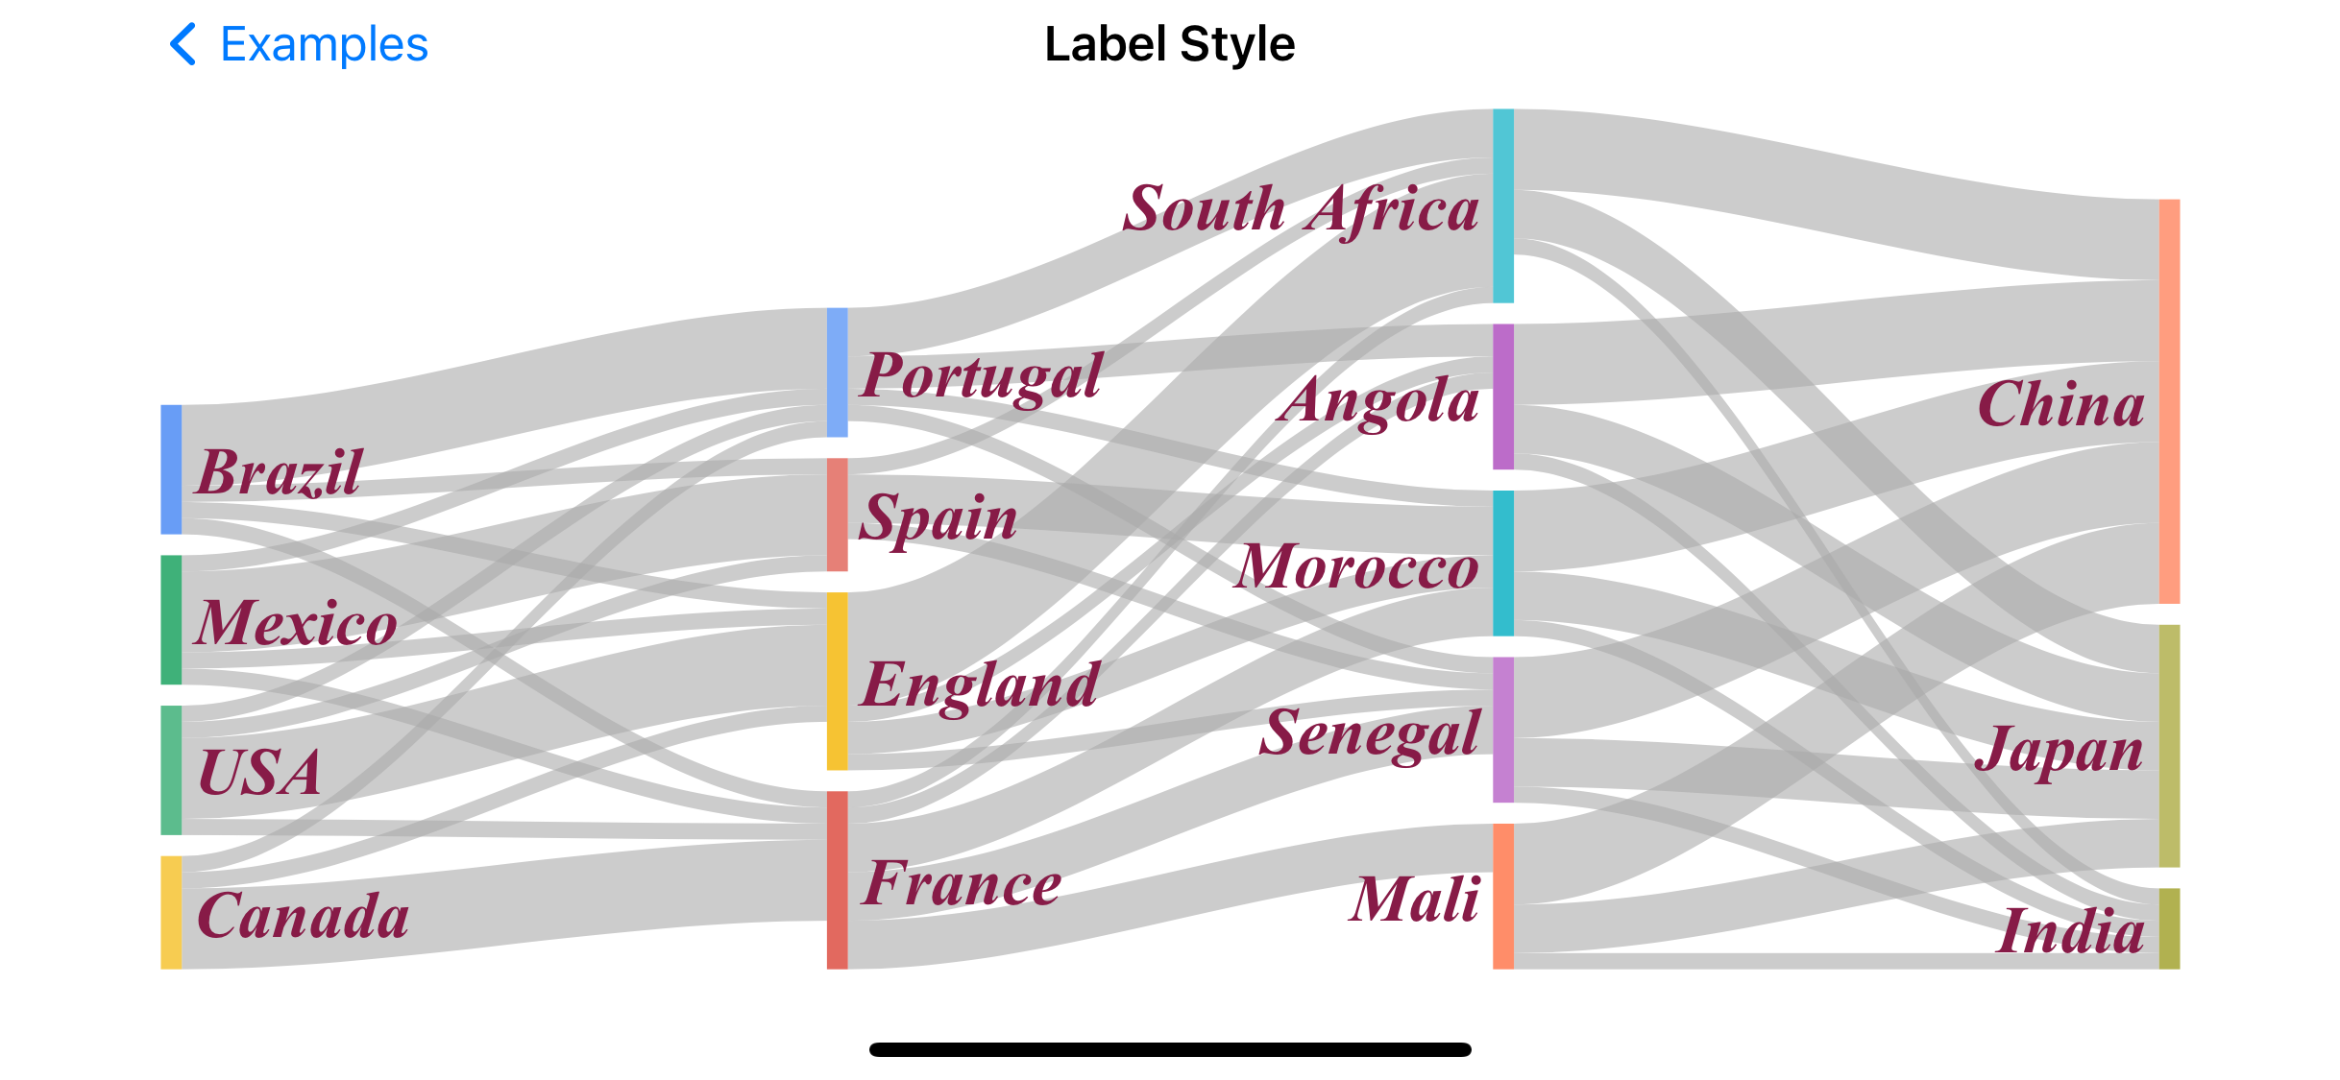
)- Label Style | Code | Inspiration
SankeyDiagram(
    data,
    nodeLabelColor: "#871b47",
    nodeLabelFontSize: 32,
    nodeLabelFontName: "Times-Roman",
    nodeLabelBold: true,
    nodeLabelItalic: true
)- Label Padding | Code | Inspiration
SankeyDiagram(
    data,
    nodeLabelPadding: 30
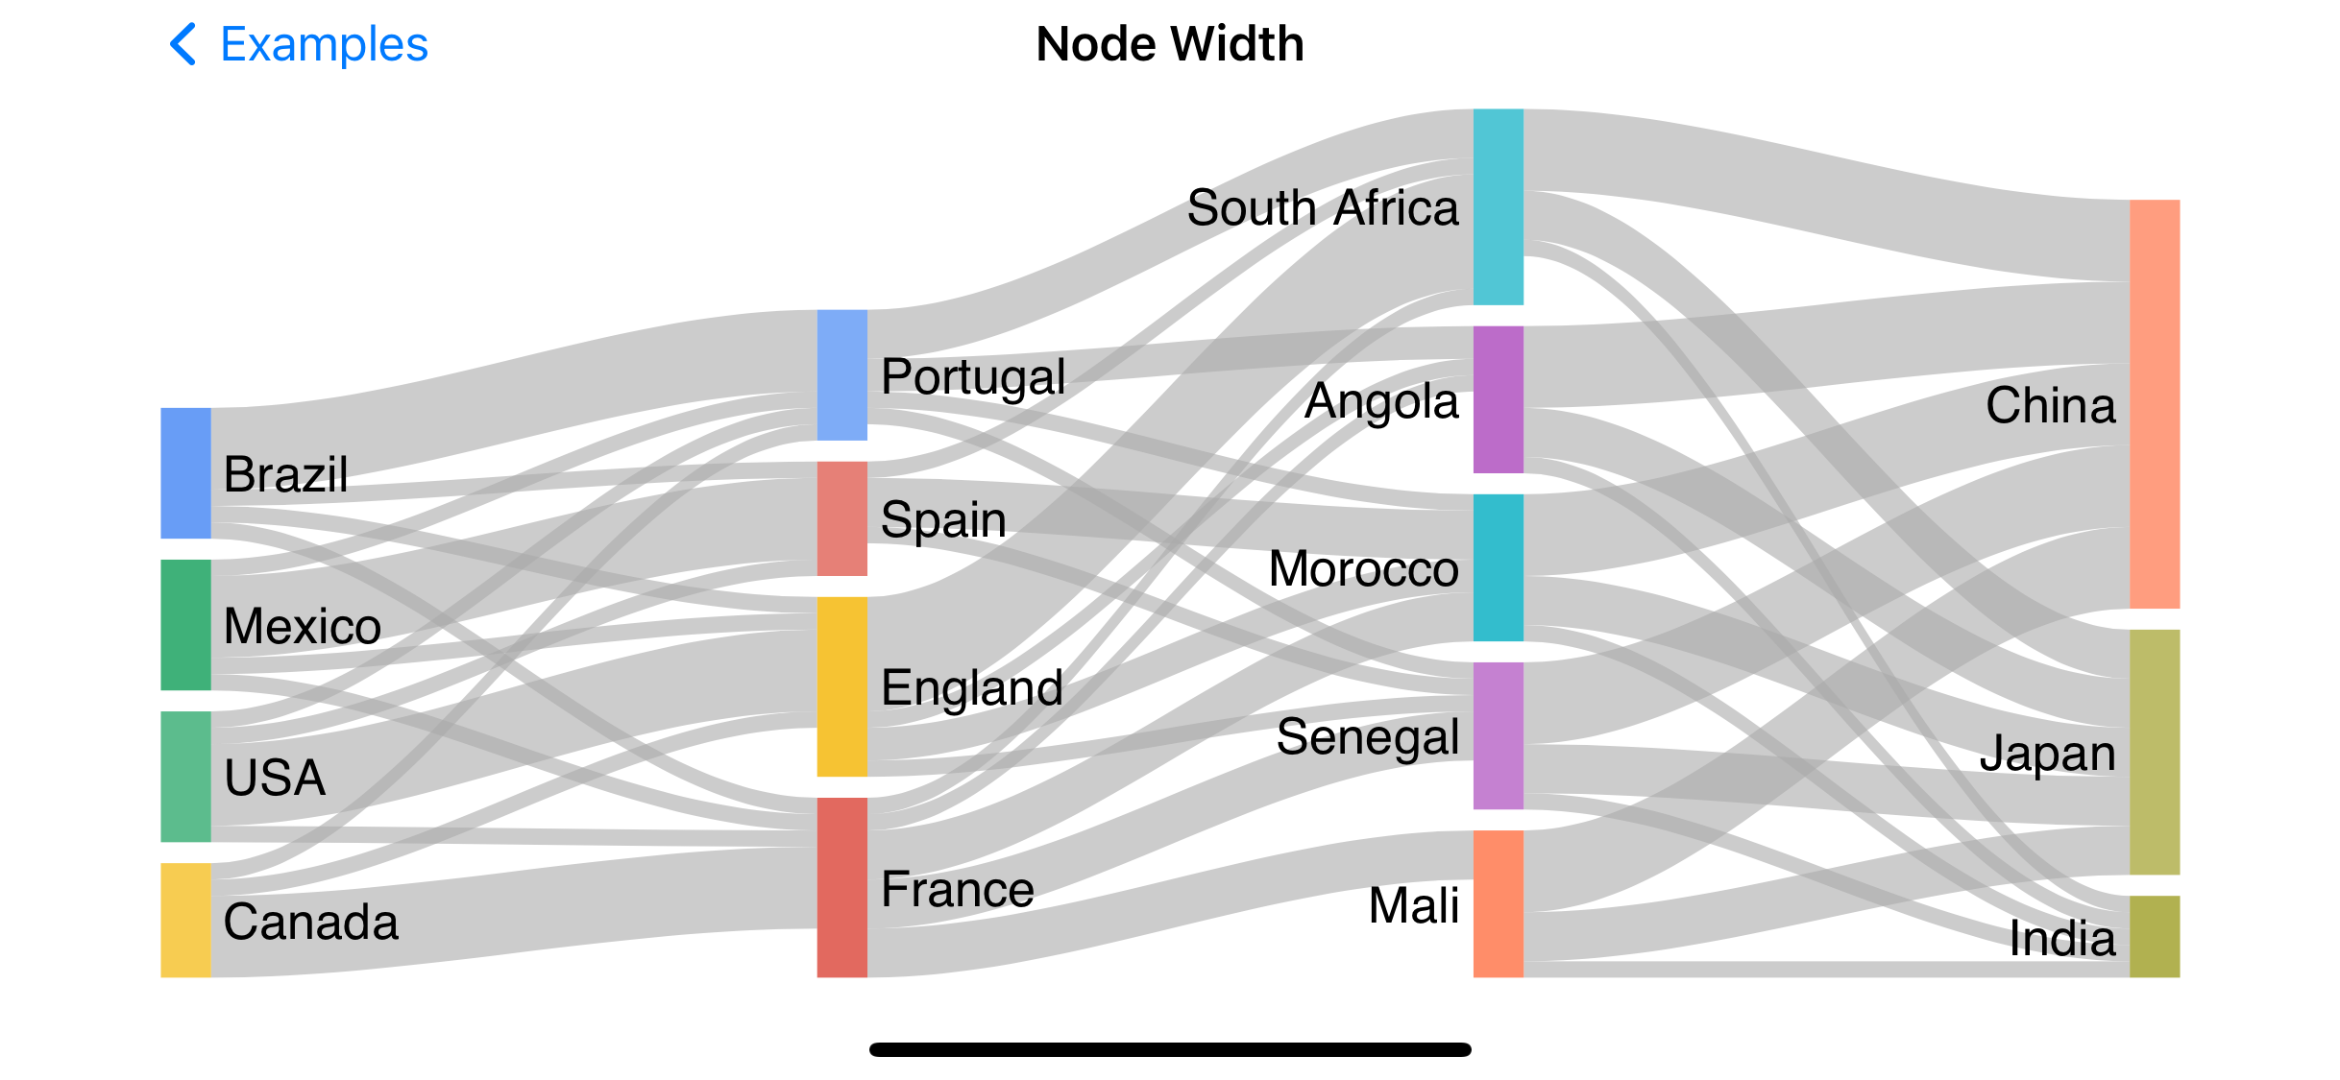
)- Node Width | Code | Inspiration
SankeyDiagram(
    data,
    nodeWidth: 24
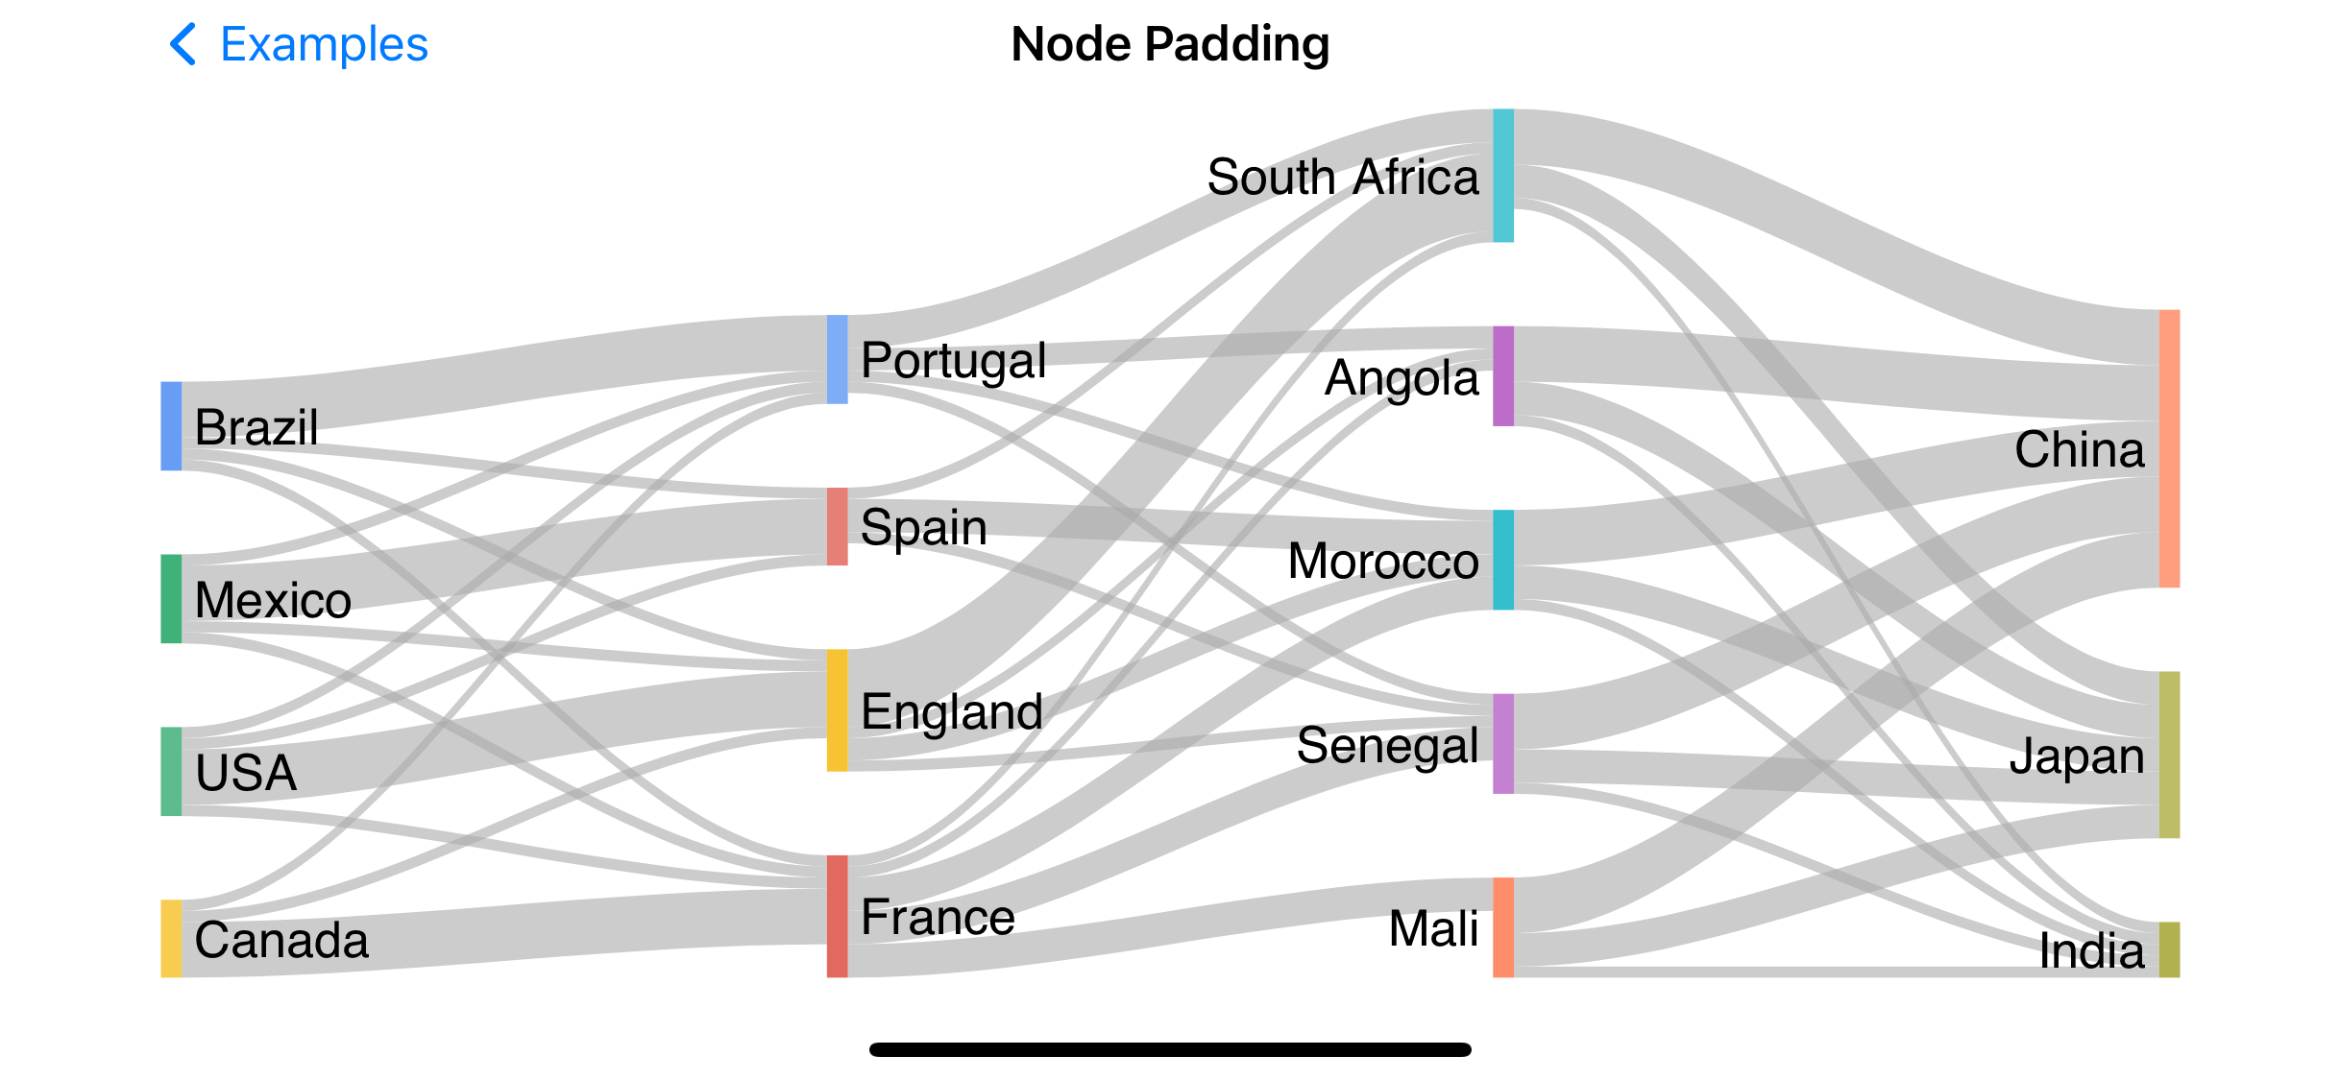
)- Node Padding | Code | Inspiration
SankeyDiagram(
    data,
    nodePadding: 40
)- Data | Code | Inspiration
let data: [SankeyLink] = [
    ["Brazil", "Portugal", "5"],
    ["Brazil", "France", "1"],
    ["Brazil", "Spain", "1"],
    ["Brazil", "England", "1"],
    ["Canada", "Portugal", "1"],
    ["Canada", "France", "5"],
    ["Canada", "England", "1"],
    ["Mexico", "Portugal", "1"],
    ["Mexico", "France", "1"],
    ["Mexico", "Spain", "5"],
    ["Mexico", "England", "1"],
    ["USA", "Portugal", "1"],
    ["USA", "France", "1"],
    ["USA", "Spain", "1"],
    ["USA", "England", "5"],
    ["Portugal", "Angola", "2"],
    ["Portugal", "Senegal", "1"],
    ["Portugal", "Morocco", "1"],
    ["Portugal", "South Africa", "3"],
    ["France", "Angola", "1"],
    ["France", "Senegal", "3"],
    ["France", "Mali", "3"],
    ["France", "Morocco", "3"],
    ["France", "South Africa", "1"],
    ["Spain", "Senegal", "1"],
    ["Spain", "Morocco", "3"],
    ["Spain", "South Africa", "1"],
    ["England", "Angola", "1"],
    ["England", "Senegal", "1"],
    ["England", "Morocco", "2"],
    ["England", "South Africa", "7"],
    ["South Africa", "China", "5"],
    ["South Africa", "India", "1"],
    ["South Africa", "Japan", "3"],
    ["Angola", "China", "5"],
    ["Angola", "India", "1"],
    ["Angola", "Japan", "3"],
    ["Senegal", "China", "5"],
    ["Senegal", "India", "1"],
    ["Senegal", "Japan", "3"],
    ["Mali", "China", "5"],
    ["Mali", "India", "1"],
    ["Mali", "Japan", "3"],
    ["Morocco", "China", "5"],
    ["Morocco", "India", "1"],
    ["Morocco", "Japan", "3"]
]Optional SankeyDiagram(data, ...) styling arguments :
| Argument: | Default | Description |
|---|---|---|
nodeColors |
[String]? = nil |
Custom color (hexcodes) palette to cycle through for sankey nodes |
nodeColorMode |
SankeyOptions.Sankey.Node.ColorMode = .unique |
Coloring mode for the sankey nodes |
nodeWidth |
Double? = nil |
Thickness of the node |
nodePadding |
Double? = nil |
Vertical distance between nodes |
nodeLabelColor |
String = "black" |
Node label color (hexcode/html) |
nodeLabelFontSize |
Double = 24 |
Node label font size (pixels) |
nodeLabelFontName |
String? = nil |
Node label font name |
nodeLabelBold |
Bool = false |
Bold node label |
nodeLabelItalic |
Bool = false |
Italicize node label |
nodeLabelPadding |
Double? = nil |
Horizontal distance between the label and the node |
nodeInteractivity |
Bool = false |
Allow users to select node |
linkColors |
[String]? = nil |
Custom color (hexcode) palette to cycle through for sankey links |
linkColorMode |
SankeyOptions.Sankey.Link.ColorMode? = nil |
Coloring mode for the links between nodes (this option will override any linkColor+ argument) |
linkColorFill |
String? = nil |
Color of the link |
linkColorFillOpacity |
Double? = nil |
Transparency of the link |
linkColorStroke |
String? = nil |
Color of the link border |
linkColorStrokeWidth |
Double = 0 |
Thickness of the link border |
tooltipValueLabel |
String = "" |
Name of the link value to be displayed in the tooltip |
tooltipTextColor |
String = "black" |
Tooltip text color (html/hexcode) |
tooltipTextFontSize |
Double = 24 |
Tooltip text font size (pixels) |
tooltipTextFontName |
String? = nil |
Tooltip text font name |
tooltipTextBold |
Bool = false |
Bold tooltip label text |
tooltipTextItalic |
Bool = false |
Italicize tooltip label text |
layoutIterations |
Int = 32 |
D3 layout engine layout search attempts to find the most optimal node positions (increasing this number may lead to more pleasing layouts of complex sankeys, at some cost) |
For more information see configuration options
Add to your project with:
dependencies: [
    .package(url: "https://github.com/maxhumber/Sankey.git", .upToNextMajor(from: "1.0"))
]‡ Active network connection required

