A retro-inspired Vue.js component for visualizing high-dimensional data. Unleash your inner retro-hacker with this Vue.js component! Now you can look at all the magical data you're working with, in one (simple?) Vue.js component!
- displays any NDArray of data [up to three dimensions] (well if your screen has enough room, at least)
- responsive - the tensor is automatically re-drawn, ensuring it's never squished and you never loose the overview, when hacking!
Installing is a breeze, no need to fuss around with adding this amazing piece of software to npm, just install it directly from this repo!
npm i -S git://github.com/meinlebenswerk/VueTensor.git
If you're on the yarn side of things, it should be:
yarn add git://github.com/meinlebenswerk/VueTensor.git
But I don't know if that's correct, so use it at your own risk ;) Afterwards, tell Vue to use the plugin (I don't know how to properly publish something, that can be imported directly, so it needs to be installed globally, for now... ) To do this, add the following lines, to you Vue.js entry-point (most likely main.js or main.ts)
import  VueTensor  from  'VueTensor';
Vue.use(VueTensor);
And you're good to go! You can now use the component via:
<TensorVisualizer/>
There's several props on the component, which are use for configuration and passing data: Down below are all the props, a typescript-esque syntax is used (name:type = defaultValue).
backgroundColor: string = '#191919'
foregroundColor: string = '#e3e3e3'
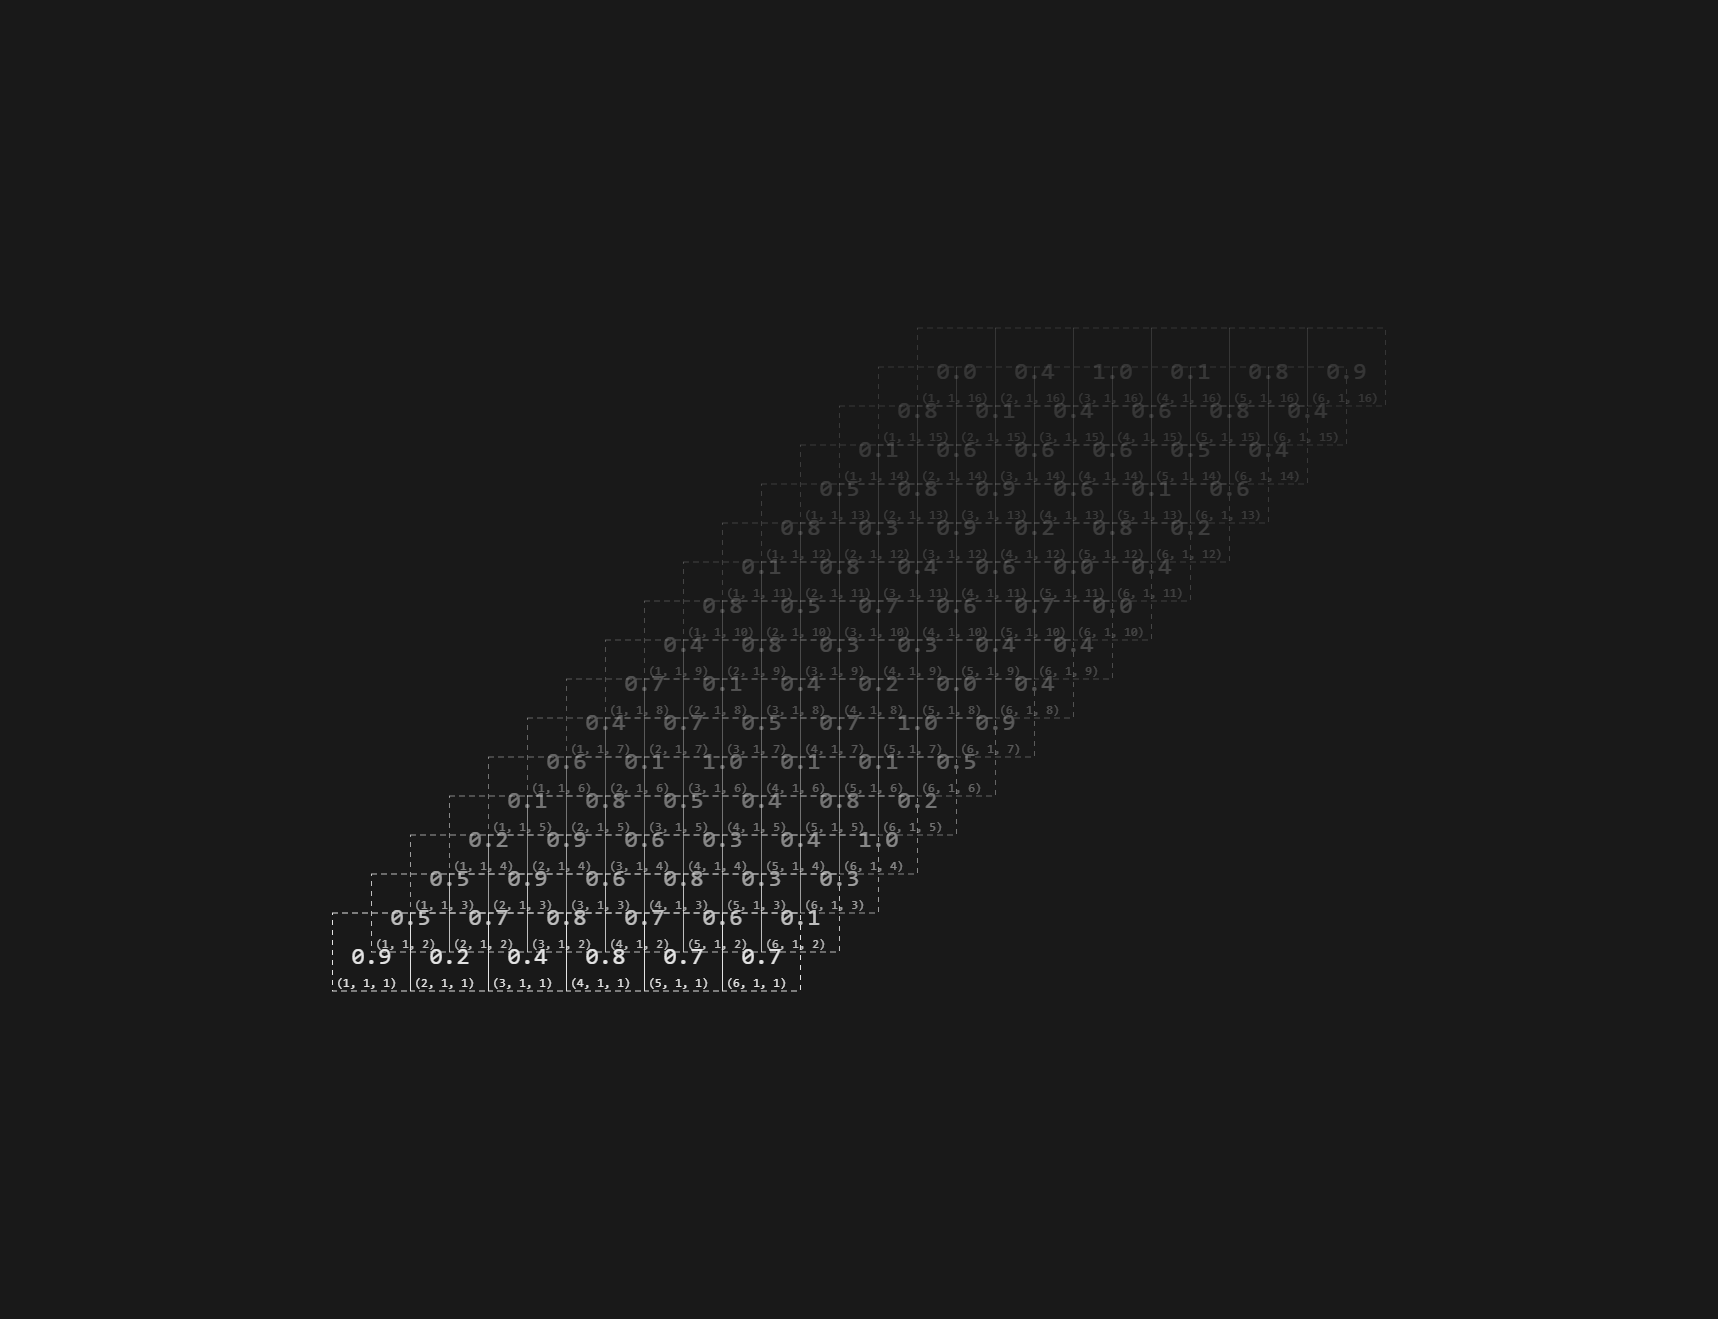
tensor: Object= { shape: [6,1,16], data: []}
indexType: 'vector_base0' | 'vector' | 'scalar' | 'scalar_hex' | 'none'
alphaFalloffConstant: number = 4
fillPercentage: number = 80
showBoundingBox: boolean = false
back- and foreground color set the colors, please use hex-colors, since otherwise, the alpha-blending (and maybe drawing?) will break. The tensor holds the data to be displayed, the shape indicates it's x,y,z dimensions, but you can leave them, out, in which case, they will be filled with ones. It's data-property holds the tensor's actual values, if you pass nothing in, the data will automatically be filled at random. The index-type prop sets wheter, and if so, what kind of index-annotation should be used
- none - disables index-displaying
- vector_base0 - displays the index as a zero-start vector
- vector - displays the index as a regular vector, more akin to the ones you're used to from mathematics
- scalar - uses 0-based scalars as indices, the scalar_hex variant encodes them as base16, for that additional hacker-flair! The alphaFalloffConstant controls how much then alpha of layers after the first falls of, setting it to zero disables the falloff completely. Since the data is drawn responsively, and the canvas automatically fills it's parent container, the fillPercentage prop can be used to inset the tensor inside the visualizer, changing how much space it can use up. (You could also use this for an improvised zoom-functionality, but I haven't tested what happens if you increase this beyond 100...) With showBoundingBox you can display a nice bounding-box around the data, this will most likely be useful for debugging.
That's it, if you have any great ideas, or discover an Issue with the code, feel free to contribute! Happy Hacking!