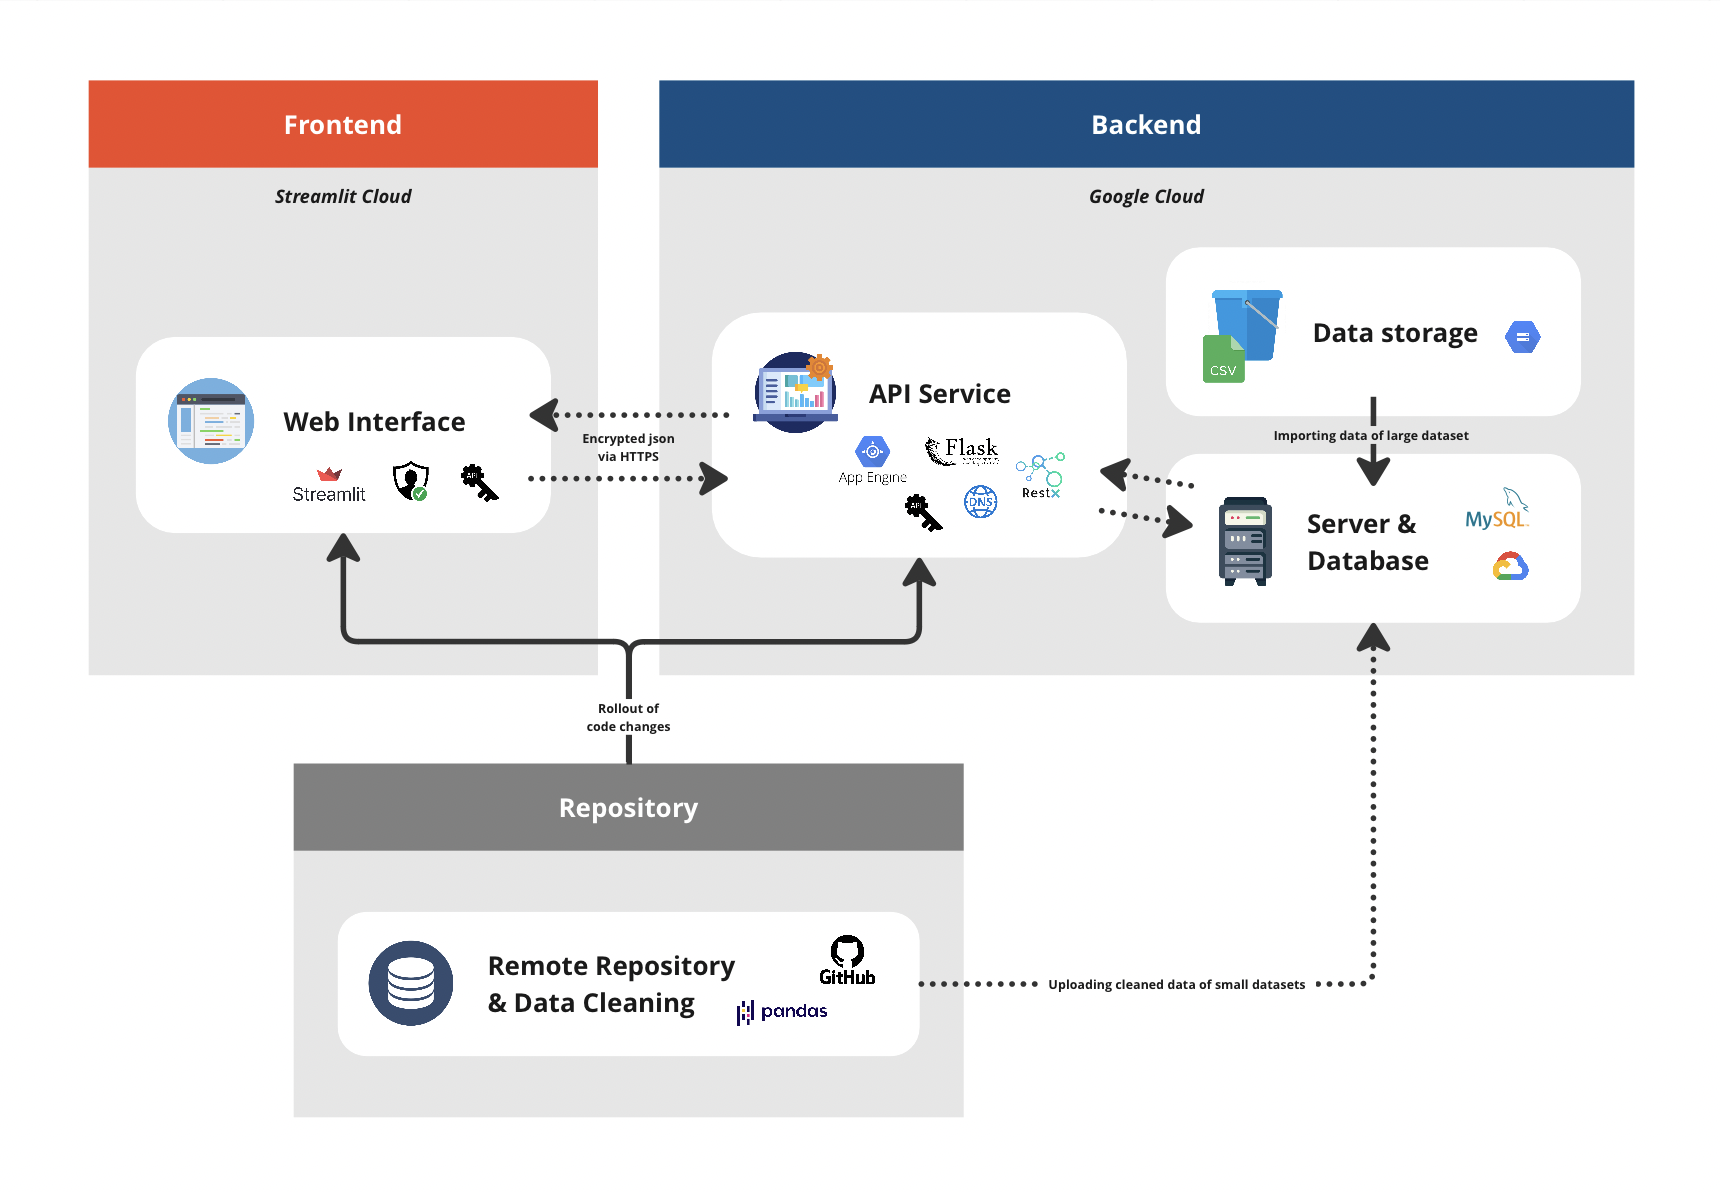
This repository contains the code for the capstone project. The project's objective is to establish a data visualization dashboard, which includes understanding and cleaning the dataset, deploying a database solution (e.g. MySQL), integrating a back-end service for the API and developing a front-end.
The structure of this repository is as follows:
- API
- Developed with Flask-RestX
- To deliver data, an API-key in the header is required
- The API connects to a MySQL database in the Google Cloud
Deployed with Google Cloud (App Engine)
- App/ Client
- Developed with Pandas, Streamlit, and Streamlit Authenticator
- To view the visualized data, a username and password is required
- Allows for data analysis and insight generation
Deployed with Streamlit Cloud (through GitHub repository)
- Architecture
- Holistic overview of the solution's architecture
- Data
- Individual data files: customers, transactions, and articles (csv format)
- Data Cleaning + Upload
- Developed with Pandas
- Cleaned to avoid duplicates, missing values, or various variable-content definitions (e.g. NONE, None, none)
- KPIs
- Developed with Pandas
- Uploaded as individual tables to the database to increase the request time
- Web Catalogue
- Developed with Bootstrap, HTML, and JS
- Web Catalogue to see product portfolio
More detailed documentation about the api and app can be found in their respective folders (README)