-
-
Notifications
You must be signed in to change notification settings - Fork 19
Vessel
Vessel is the FarNet module for Far Manager providing heuristically improved history lists (smart jump lists, self-organizing lists) and tools for opening files, navigating to folders, invoking commands.
Vessel records history of operations invoked from smart lists and uses this information for optimizing these lists. Items having more chances to be used soon are closer to the top.
The name originally comes from "View/Edit/Save/SELect history".
See the details about the module in its README.
This topic provides some technical information.
Vessel implements an advanced self-organizing list.
Simple self-organizing list techniques:
- Move to front method (Far Manager history lists)
- Count method
- Transpose method
Our current model is non-parametric based on combination of "move to front" and usage patterns extracted from the history. We assume that "interesting" items tend to be used periodically.
Items are grouped, ranked, and sorted as described below.
Group 0
The most recently used items (2 last hours) are sorted by last used times. This is the "move to front" method which is also used by Far Manager.
Group 1
Older items are sorted by evidences of uses in the past for approximately same idle times as items have now. The time is represented by spans on logarithmic scale (2, 4, 8, 16, ... hours).
For the given item idle time we get its span log2(idle hours), count recorded
evidences for this span, and use this information for sorting.
Group 2
If the items are still equal by ranks then they are sorted by last used times. It is the "move to front" method again, only moving to the top of same groups.
It is good. It is not necessarily optimal. But it is much better than sorting by last used times. This claim is supported by tests comparing smart histories with simple.
How test comparison works. For each history record X we build the smart list sorted by ranks and the normal list sorted by times. The lists are built from the previous items in history and we know that the next item to be used is X. So we compare the item positions in two lists. In most cases the ranked list wins, i.e. the item is much closer to the top of the smart list.
It is worth to mention that in the beginning of history records the gain is low and smart lists are basically sorted by times. But the more you use these lists the smarter they become.
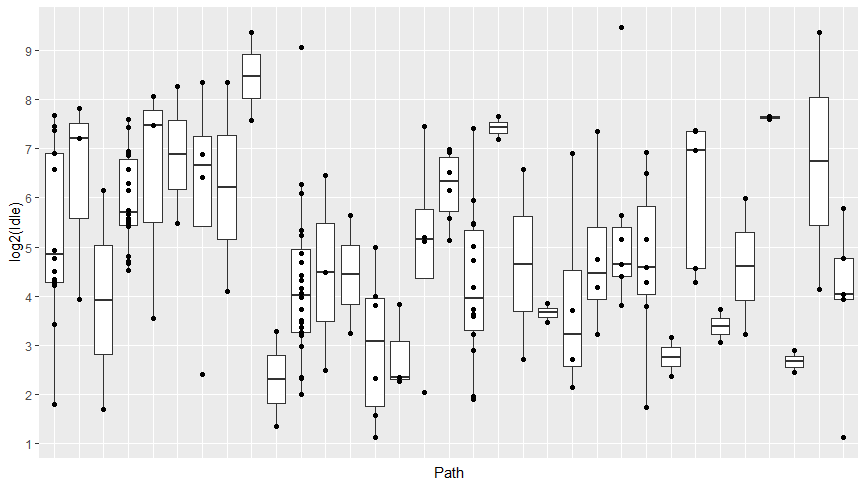
The following picture represents a snapshot of history records. The axis X is
list items. The axis Y is the logarithmic time (log2(hours)), horizontal
lines separate idle time spans. Dots are recorded uses of items.
Different items exhibit different use patterns. These patterns are taken into account by our ranking. Note that item priorities may increase over time even if items are not used. An item becomes more expected when its idle time approaches its active span.

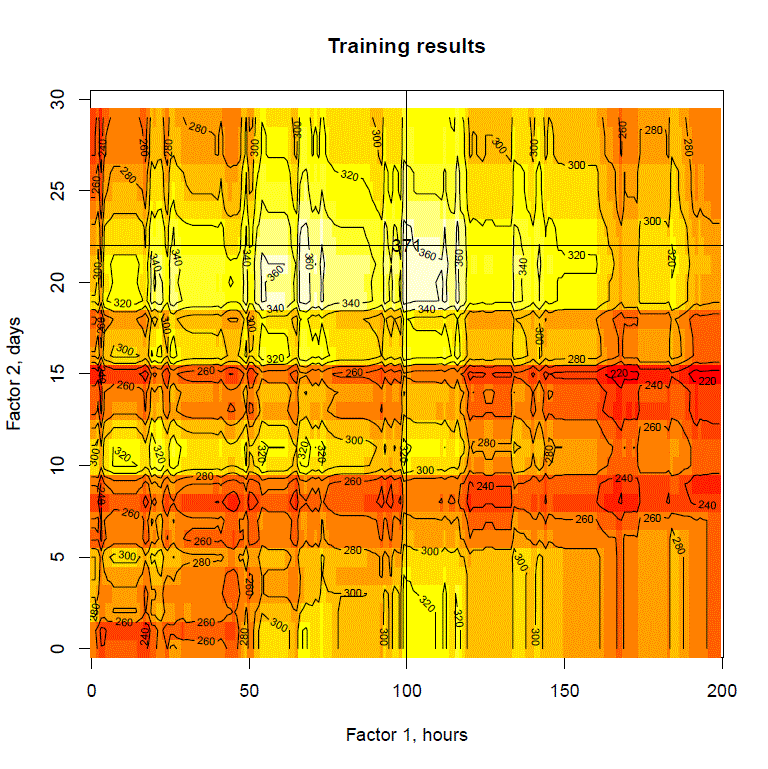
The following picture is the research history. It represents training results of the old less effective parametric model with two factors. The white area shows the best factors.

FarNet
Modules
- CopyColor
- Drawer
- EditorKit
- FarLite
- FarMongo
- FolderChart
- FSharpFar
- GitKit
- JavaScriptFar
- JsonKit
- PowerShellFar
- RedisKit
- RightControl
- RightWords
- Vessel
Libraries
F# Libraries