Youtube Link: https://youtu.be/aLIijp6EvVg
Motivation: The motivation for this project came from my earlier project that I have done on Mass shootings in the states. My main driving source for taking up this challenging project was to see that what are the underlying causes of so many mass shootings in the states and to prove or discredit the theory that the media has been talking about that the lenient gun laws are the root cause of people with or without criminal history killing innocent citizens without any cause.In my My deception project I have tried to do something different but related to Gun Laws. I plan to analyze data on suicides in the states using Gun and see where it leads me. After finishing up the Project I hope to achieve a clear understanding of why such heinous crimes took place and are suicide related to gun laws in any way.
Objective: Today, data becomes a driving force to make decisions affecting millions of people. Since this is a deceptive project, I will try to show what the data actually tells its viewer and how can it be manipulated to something completely different and misleading to convince people otherwise.
Data: The data I have found for this project is from Centers for Disease Control and Prevention database by using their wisqars platform. But before extracting the relevant data, following filters have to be applied:
- In report type, go to Incidents of Violence and check the field All Violent Incident Counts and Percentages
- Select suicide in intent or manner of injury based on the abstractor
- Select Firearm in cause or mechanism of the injury
- Select All years of report for the report generation
- Select Spreadsheet as the type of report and submit
- Link of the data set: https://wisqars.cdc.gov:8443/nvdrs/nvdrsDisplay.jsp
Project plan: This project will be based on exploration rather than confirmation.
- Select a topic of interest
- Find credible and reproducible data source
- Analyze the data to come up with a claim
- Add additional data to come up with a counter-argument
- Make several intermediate versions
- Critque the intermediate versions to come up with a final version
- Descibe the final version and scope of improvement
- Make a short video explaining the visual
Data wrangling steps have been written in the python notebook. In order to show the deception, I had to find population for every state for every year from Google and incorporate that in the python notebook.
The web query used for the population was, just replacing the state and year in question:
For doing this deceptive visualization I went through many articles studying about the gun violence and in particular suicides cases where some form of guns were used.
Audience: The audience of this visualization is the people who have been either pro-Gun Law or Pro No Gun Law.
For the pro-gun Law supporters, a case can be made that suicides increase when there is an easy an access to guns as people who are depressed or unwell have an easy way out by just shootings themselves.
For the Pro No Gun Law- Seeing this visual they should realize if this is just the suicide data alone then how would the visual look like if every gun-related death has been included. Some of these states have very few population and a high percentage of suicide just by guns is a cause for concern for everyone.
Claim: Firearm Suicide Deaths & Percentages show opposing trends!!
Qualifier: The qualifier for this data is taken in such a way that every group is being represented. There are top gun restrictive states and then there are the least gun restrictive States for the deceptive project. The state Rankings in terms of their restriction on Guns from High to Low are as follows:
- New Jersey
- Massachusetts
- Maryland
- Alaska
- Oregon
- Virginia
- South Carolina
Data: The data is collected from CDC which did a federally funded study in the 7 states which were New Jersey, Massachusetts, Maryland, Alaska, Oregon, Virginia and South Carolina from 2003 to 2014.The data is highly credible and contamination free.
Warrant: The warrant for the claim has been discussed in detail in the Final Visualization section.
Backing: The Backing for the warrant is the data itself which shows clear trends on what has been happening
Colour Code is Same throughout the Visualization. The reason it has been done so that it is easier for the audience to remember states by colour. The colour code is given as follows:
- New Jersey - Light Teal
- Massachusetts - Red
- Maryland - Orange
- Alaska - Blue
- Oregon - Green
- Virginia - Purple
- South Carolina - Yellow
Visualization 1:
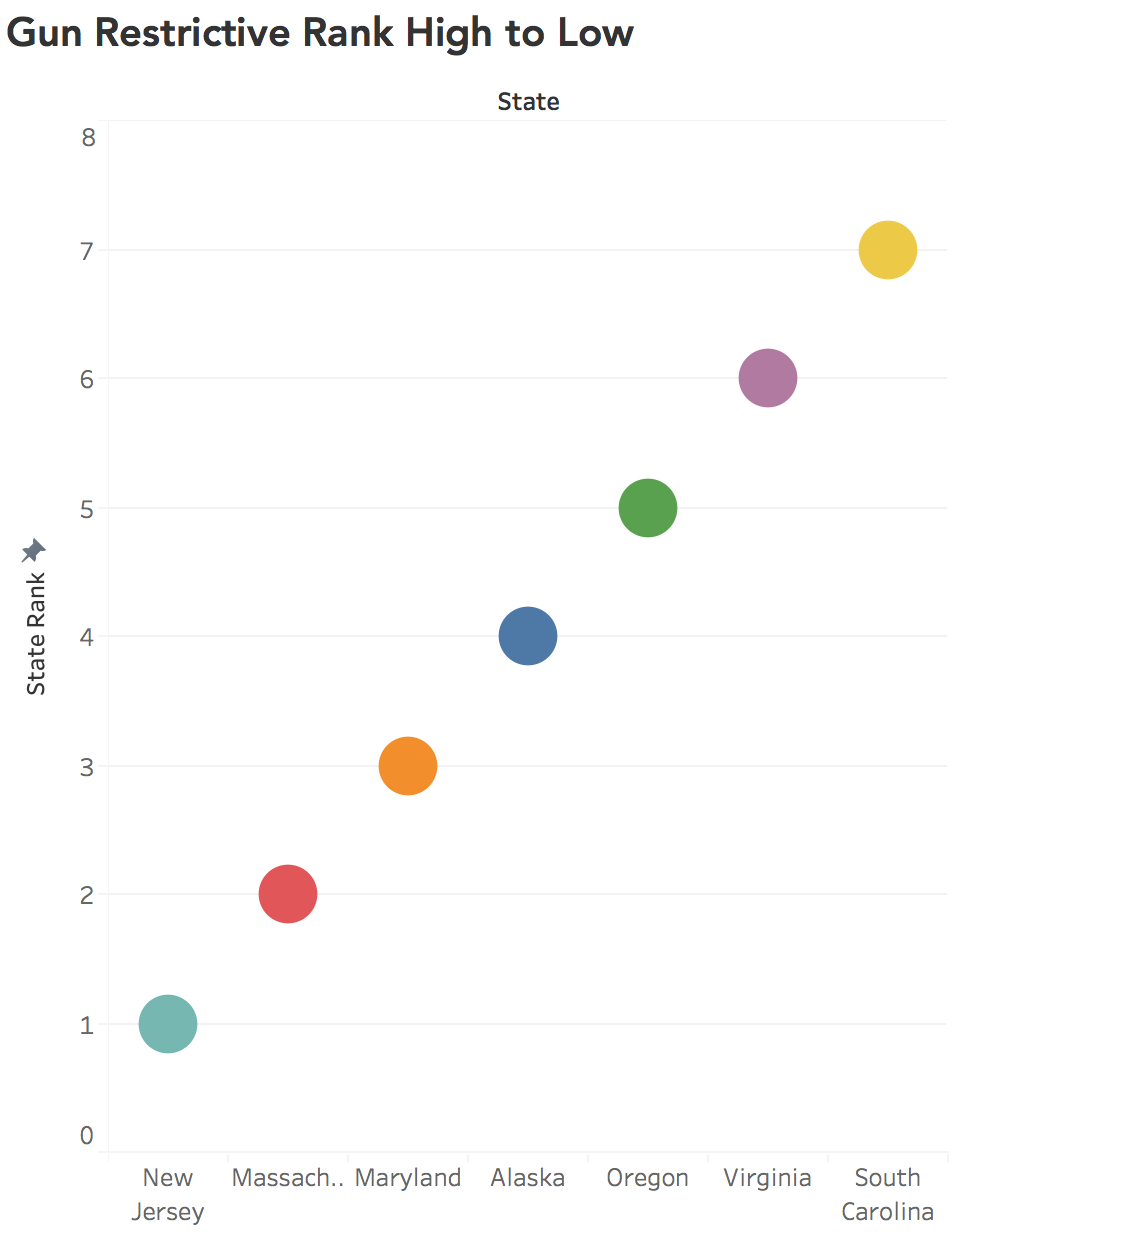
- Pros:
- This visual shows ranking of states from High to low based on Gun Restriction Law in their states
- The layman opinion that we can form from this visual going forward is the most restrictive states should have less number of suicides using guns
- Cons:
- The visual is incomplete and just shows the ranking based on which we can form different opinions
- We need the state data to clear tends and what has been happening
Visualization 2:

- Pros:
- This visual is way better than my previous visual as it starts telling us a story
- This visual is representing number of total suicides every year from 2003 to 2014
- It also shows the distribution of avg. number of suicides to let the viewers form an idea in terms of which state has a more average suicide rate
- Cons:
- The claim and the visual still have no relation whatsoever.
- Something more can be done to better represent the data and show the objective of the visual
Visualization 3:

- Pros:
- This visual is again an extension of the previous visual and it has a trend!!!
- The best thing about this is that we can see how the rates have changed over the year in suicide rates
- Also, the trend line indicates what the future holds for that state in terms of Gun Suicide if the relevant people don’t take any steps
- Cons:
- Lot of colours and can be done more simply
- Viewer might form an idea that is bad choice for a deceptive project as how can data be manipulated here
Visualization 4:

- Pros:
- This visual takes the most restrictive state and tries to represent Gun Suicides in that states
- The main purpose here was to let the viewers know the average suicide numbers in the Most restrictive state.
- This should make the viewer think if this is just the suicide data than how would the visual look like if every gun homicide is included
- Cons:
- No trace of deception development
Visualization 5:

- Pros:
- This visual takes the least restrictive state and tries to represent Gun Suicides in that states
- Now the viewers can notice that the Suicides by Gun is more in a state that has lenient laws when it comes to firearms
- Cons:
- Now seeing this visual the viewers might assume that lenient states have more suicides compared to restrictive states
Visualization 6:

- Pros:
- This is the intermediate Final visualization which represents the average number of suicides and the percentage of the population the suicide death constitutes
- Dual axis has been used to visualize the trends that we get and see if data is intersecting anywhere
- Cons:
- The shapes are confusing and can be done more simpler
- Dual axis not required here to better present the data

Visual 1:
- In the final visualization, we can see that there is no actual trend between the suicide by firearm and the gun restrictiveness of the state
- Alaska has the least suicide death because compared to others as it does a large population as the other states in the study
- Virginia is kind of neutral in gun laws likes to describe itself neither pro-gun law nor a pro no gun law kind of state. So people are free to buy guns and when their mental states is not at its best they tend to shoot themselves
- The Next two states South Carolina and Virginia are two most lenient and pro No Gun law state and as it is evident from the visual, lot of people are taking their lives when they get depressed
- Now we look at the top three Pro-Gun Law States, and as we can see that they are in the middle of the scatter plot differing by small numbers.
- Massachusetts, the third highest gun restrictive state has very few gun suicides which can make for a case that yes the law is preventing people to buy guns and shoot themselves
- New Jersey, and Maryland the 2nd and 4th most restrictive gun law states have also low gun suicides compared to their counterparts, bolstering the above claim.
- So far the audience might feel that the pro no gun law states have fewer suicides by guns then pro No Gun Laws states.
Visual 2:
- This is the interesting visualization where we can see the deception by just showing the percentage of the population taking their own life using firearms.
- The magic of percentage over data is clearly evident from this visualization
- Alaska has the least no of suicides but has the highest death percentage. A recent study has indicated as we move up up the latitude the suicide rate increase. The possible reasons could be that the people get depressed in cold dark regions very soon and just shoot themselves.
- The reason why Alaska has the highest percentage here due to the fact that it has a very low population and the suicide to population percentage is thus very high compared to others.
- Again Oregon has lower no of deaths than South Carolina but has higher percentage of firearms than South Carolina as when we take population in account the, their size becomes a really important part of this discussion
- Virginia has the highest gun suicide numbers but its somewhere in the middle when it comes to death by population percentage because of the fact that Virginia has a population of approx. 8 million.
- The top 3 most gun restrictive state follow the same trend as the earlier graph as they don’t have a very big gap in population and more importantly the ratio of the death to population is not very big
Conclusion: Therefore a finall conclusion that can be made from this deceptive project is that if the auidence was only shown the second visualization it could have been very misleading beacuse a state such Alska will always show a higher percentage beacuse the ratio of Gun suicde to population is always greater than other states beacuse Alaska has a really low population and a state like virginia which has the highest population between all the states that is represented here will show a log suicide percentage because of the fact that suicide to population is very low.
- Improvement - Include more data from other states to form a better case and more concrete evidence
- Outcome - If this is implemented, a better understanding of the situation can be achieved as Us has 50 States and this data represents only seven states.
- Improvement - Add data From different Gun Violence sources such as Gun homicides, Mass shootings, robbery
- Outcome - If we include every gun-related death data from every state, a lot of questions can be answered and training sets can be created to do a prescriptive analysis.
- Improvement - Add data for the type of guns that were most commonly being used to see which firearms are causing more harm to the society
- Outcome - Adding and analyzing the data after the above enhancement has been performed will let the audience know which types of Firearms cause more injury over the others
- Improvement - Include mental data to understand the underlying cause for these suicides
- Outcome - The mental data from all the people who either kill themselves or the others can help discover why do they do what they do, and understand the triggers that led them to that point.
- http://www.slate.com/blogs/the_slatest/2015/10/07/gun_control_laws_by_state_oregon_new_york_texas_california.html
- https://wisqars.cdc.gov:8443/nvdrs/nvdrsDisplay.jsp
- https://www.cdc.gov/nchs/pressroom/sosmap/suicide-mortality/suicide.htm
- https://www.bjs.gov/index.cfm?ty=pbdetail&iid=5804
- https://www.usnews.com/news/best-states/articles/2017-05-24/database-reveals-striking-differences-in-how-guns-are-regulated-from-state-to-state
- https://www.theguardian.com/news/datablog/2011/jan/10/gun-crime-us-state#data
- https://www.statcrunch.com/app/index.php?dataid=1880699
- https://www.cdc.gov/nchs/pressroom/states/california/california.htm
- https://www.kaggle.com/walgemei/eda-the-usa-mass-shootings
- https://www.adn.com/alaska-news/article/study-suggests-connection-between-alaska-suicide-rates-higher-latitudes/2013/11/23/