Job Order Benchmark (AQO v. 1.1)
- shared_preload_libraries = 'aqo'
- aqo.mode = 'intelligent'
- min_parallel_table_scan_size = 0
- min_parallel_index_scan_size = 0
Before measuring the query execution time, each of the 113 JOB queries was executed 20 times.
The planner uses cardinality == 1 in cases where it can't calculate planned cardinality. AQO suggests cardinality estimations more precisely, where cardinality > 1. It is cause some type of 'convergence' process which can be observed as fluctuations in the query execution time from launch to launch. You can see this, this or this pictures for example. In most cases convergence achieved at 3-5 iterations.
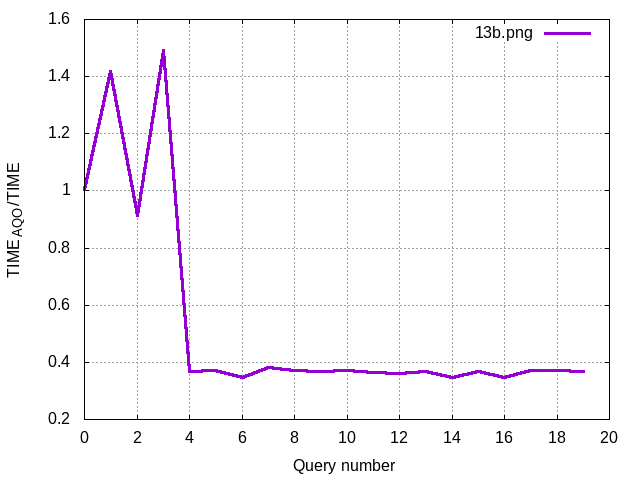
The test results are shown in the graph below. Here tvnl denotes execution time of PostgreSQL with disabled AQO extension; tAQO denotes execution time with enabled AQO extension after training; This link contains source data for the query graph.
For most queries, execution time does not changed significantly. But for some queries execution time was significantly improved up to 7 times.
Using AQO with one query, 27c.sql, lead to worsen execution time. This is a special case of zero-result queries, where most query plan nodes are never visited during execution. Features of the implementation of the PostgreSQL planner do not allow to detect such cases today and use them in the AQO extension.
