
This repository hosts results and generated graphics of benchmark executions from the Quarkus performance lab, along with the graphics code for generating charts.
Images from this repository are available at https://quarkus.io/benchmarks urls. To construct a URL, use the path of the image relative to the images subdirectory. For example, http://quarkus.io/benchmarks/spring-quarkus-perf-comparison/tuned/results-latest-tuned-throughput-for-main-comparison-light.svg. See the Chart Reference section below for a complete table of all available charts.

Assuming you have a file called myfile.json in the expected data format, you can run:
git clone git@github.com:quarkusio/benchmarks.git # this repo!
mvn -f benchmarks/graphics-generator verify -DskipTests
mkdir -p images
java -jar benchmarks/graphics-generator/target/quarkus-app/quarkus-run.jar myfile.json images true
This will generate a set of plots in an images directory.
This diagram shows the architecture & workflow of how the benchmarking executes.

Benchmark source code: https://github.com/quarkusio/spring-quarkus-perf-comparison


This table provides direct links to all available charts. Charts are available in both light and dark themes, and in both png and svg formats.


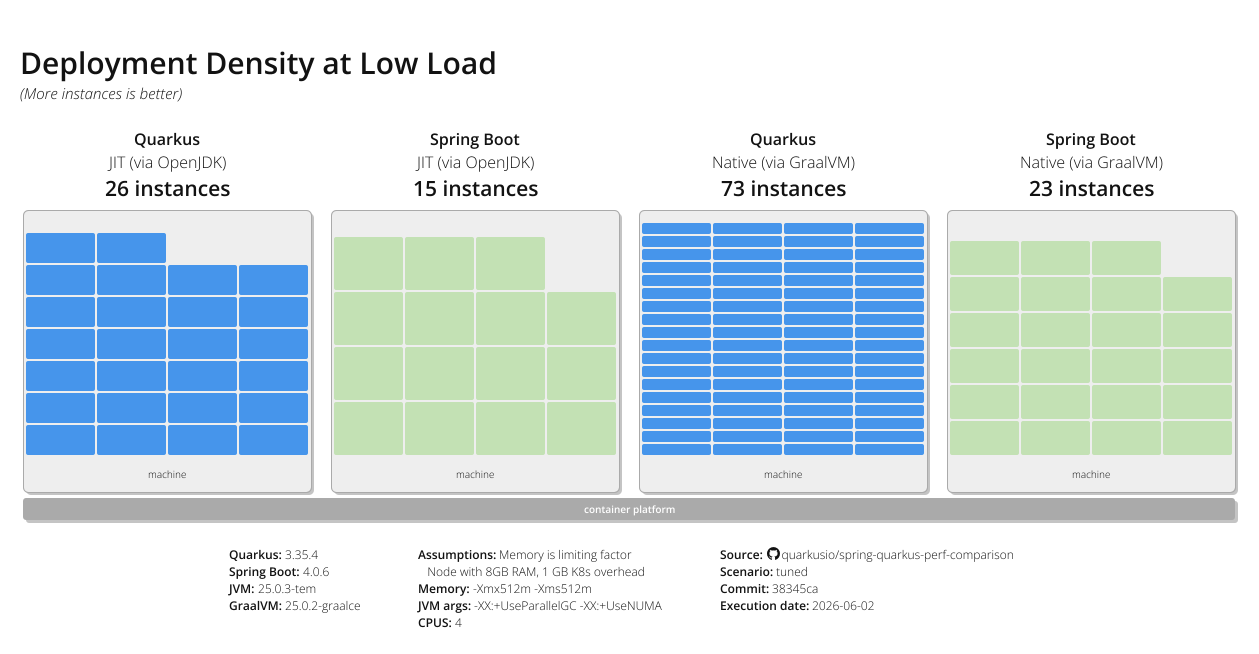


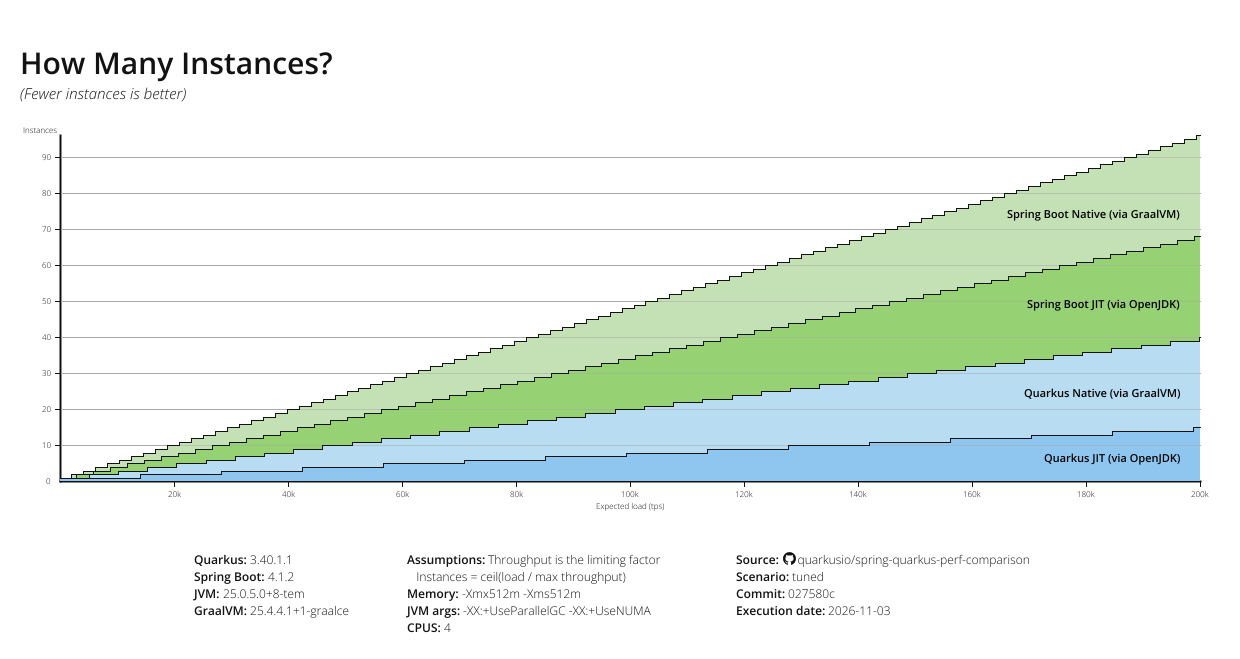
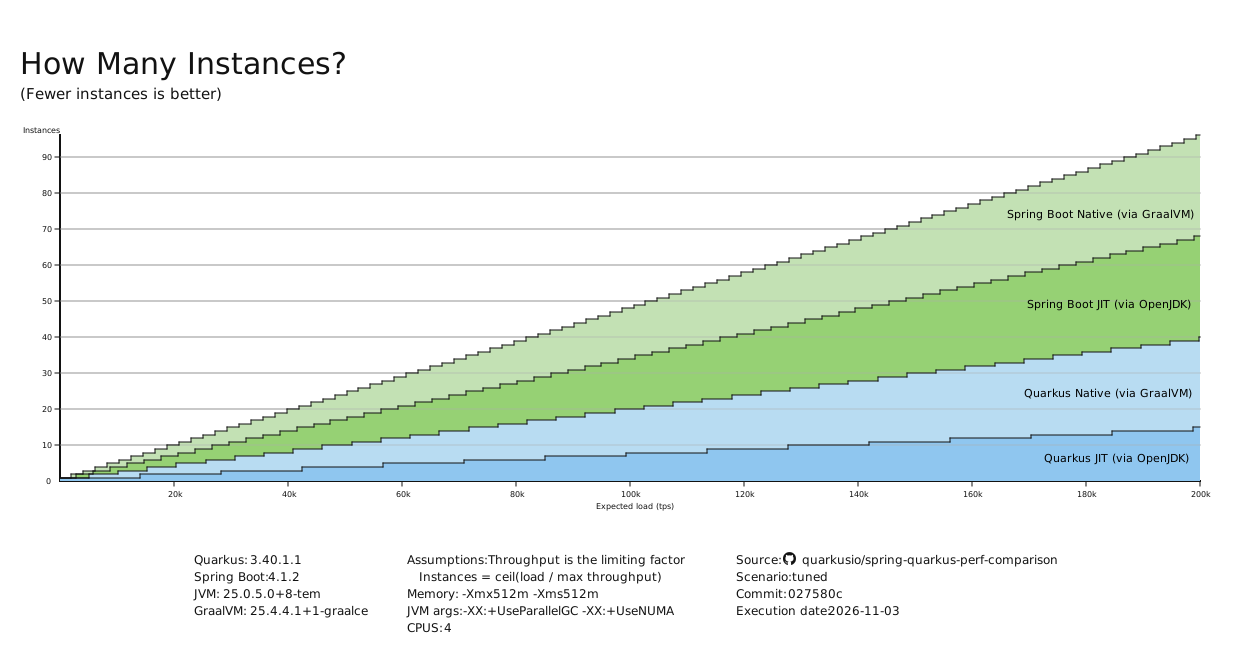
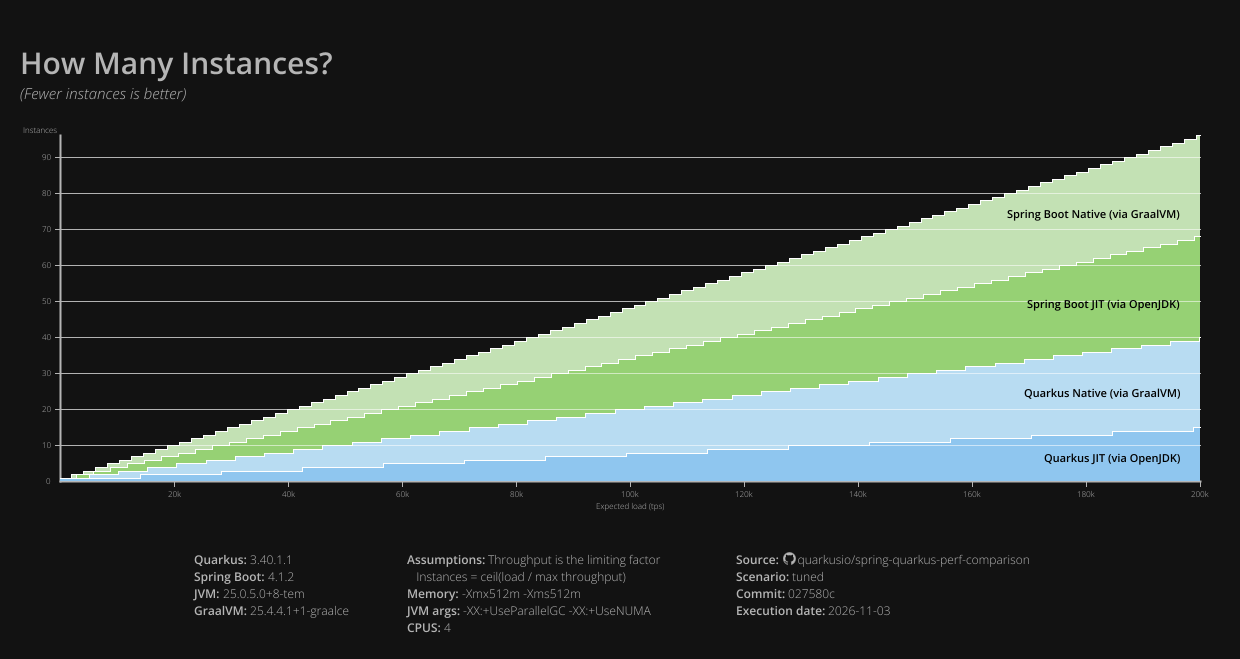
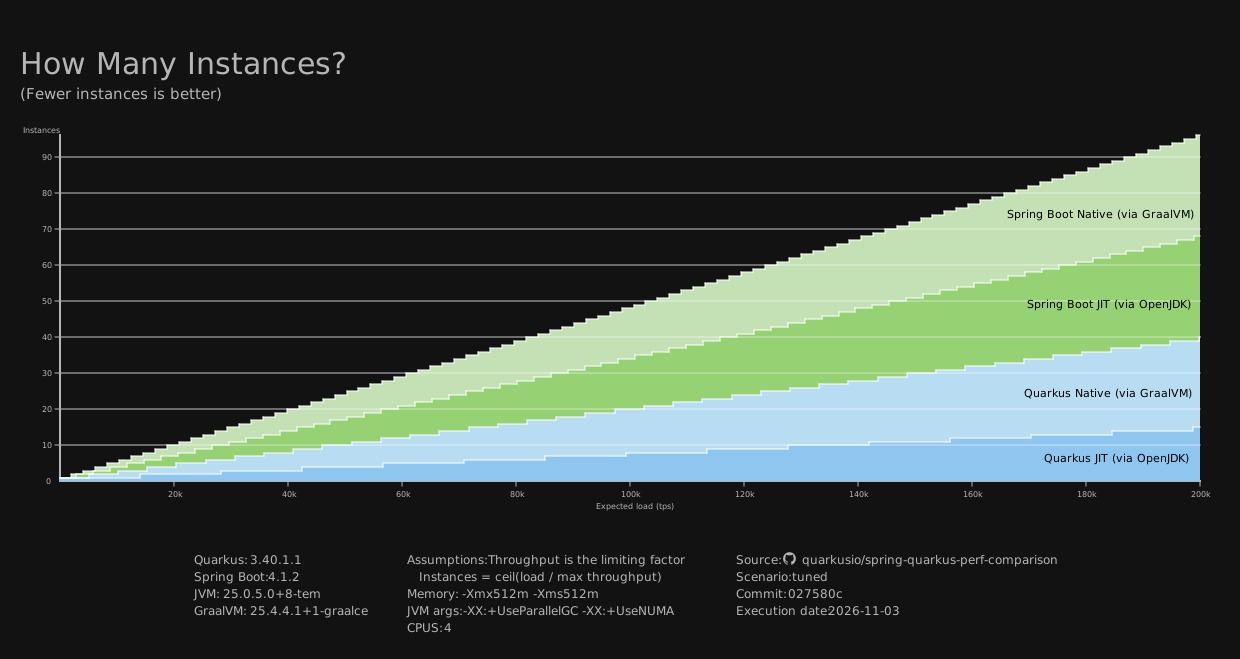


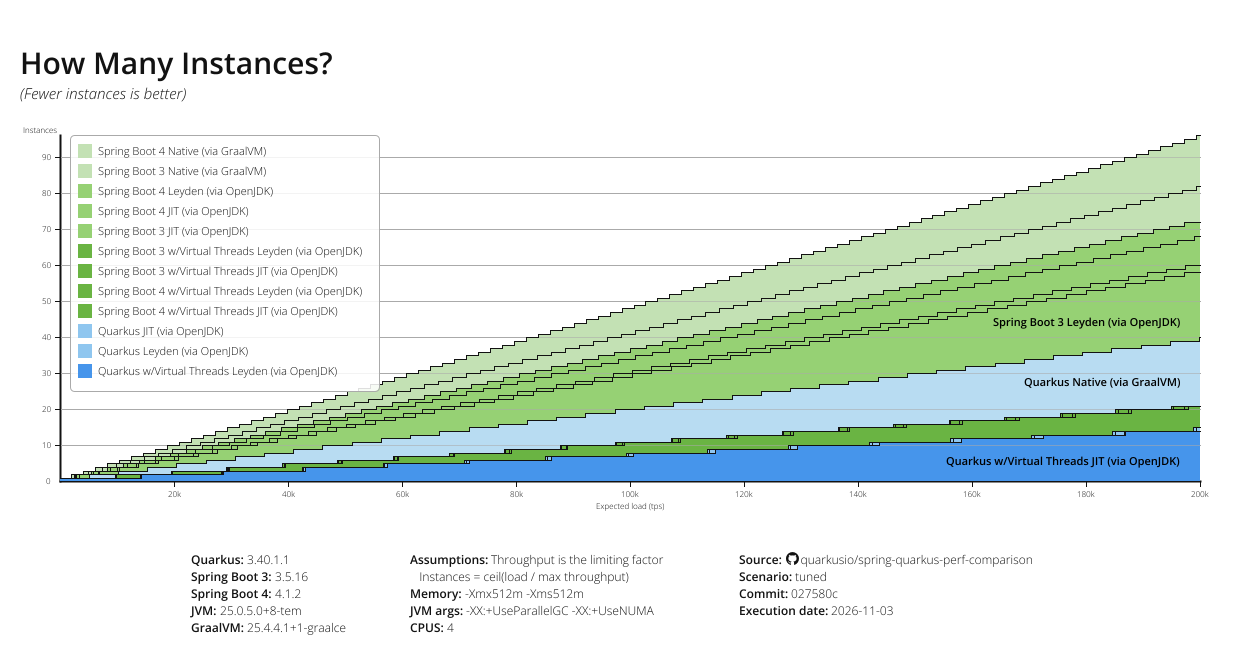
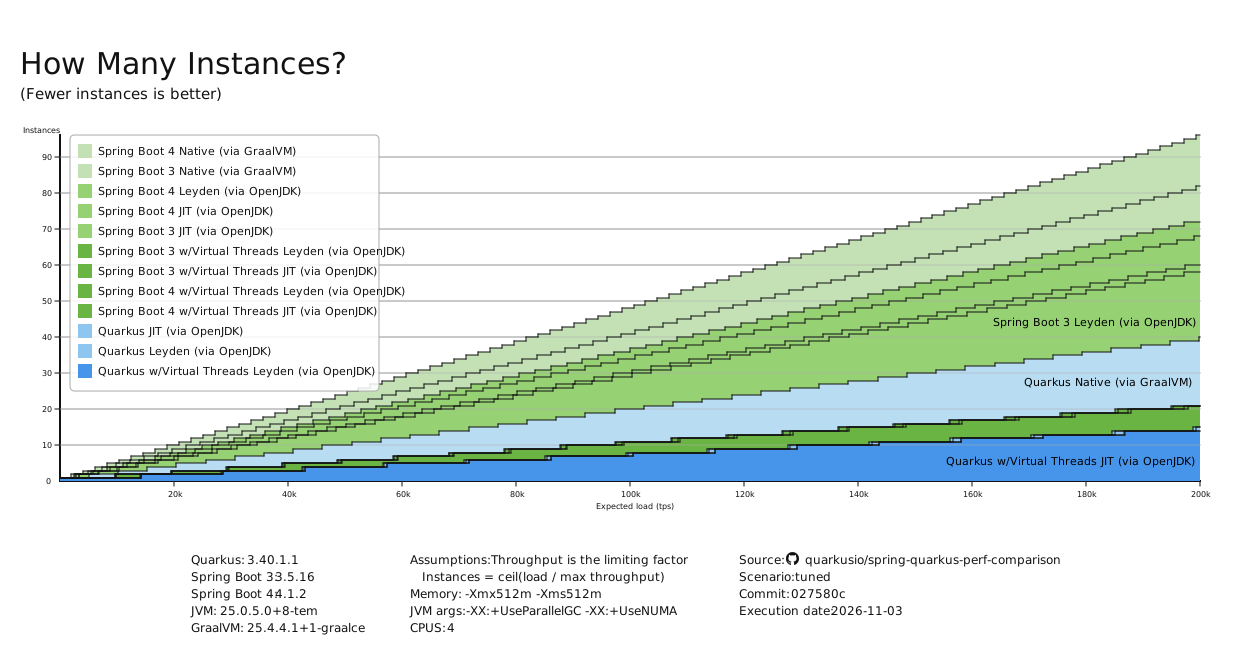
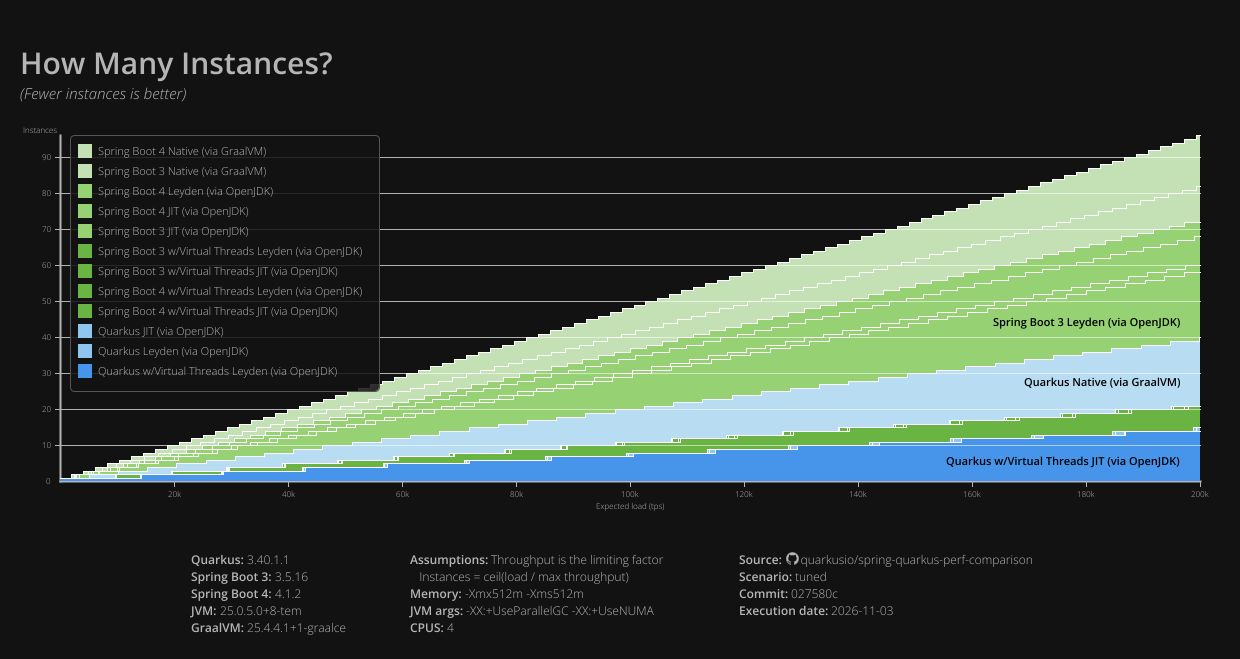
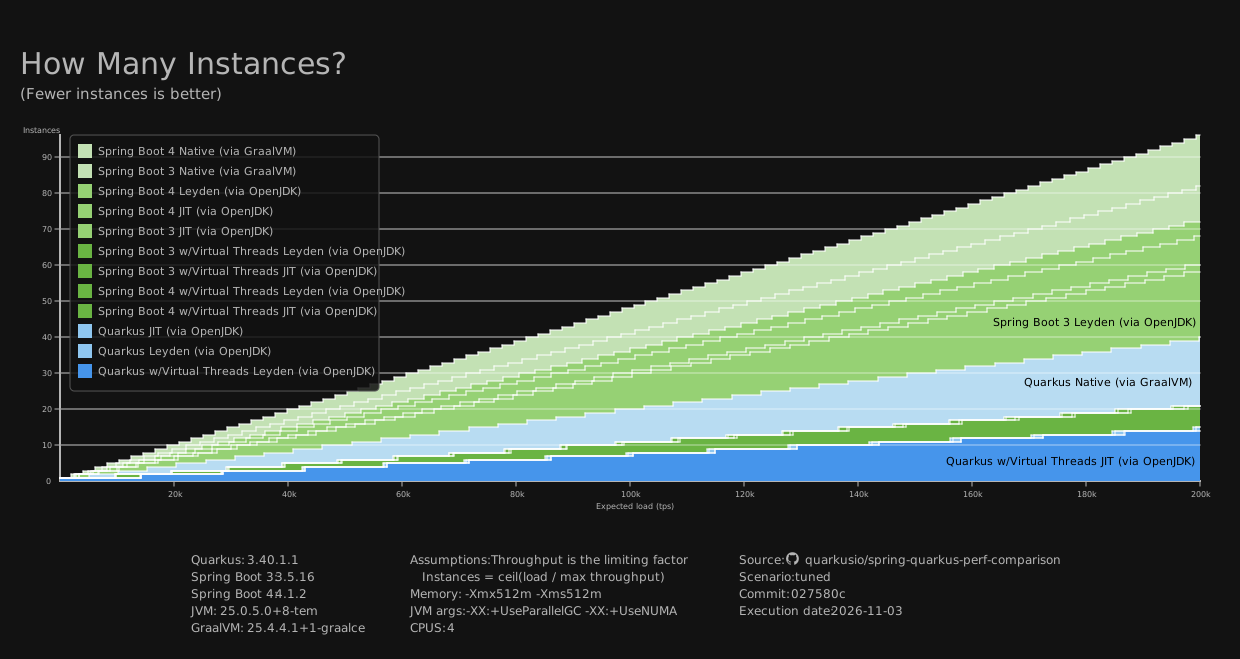


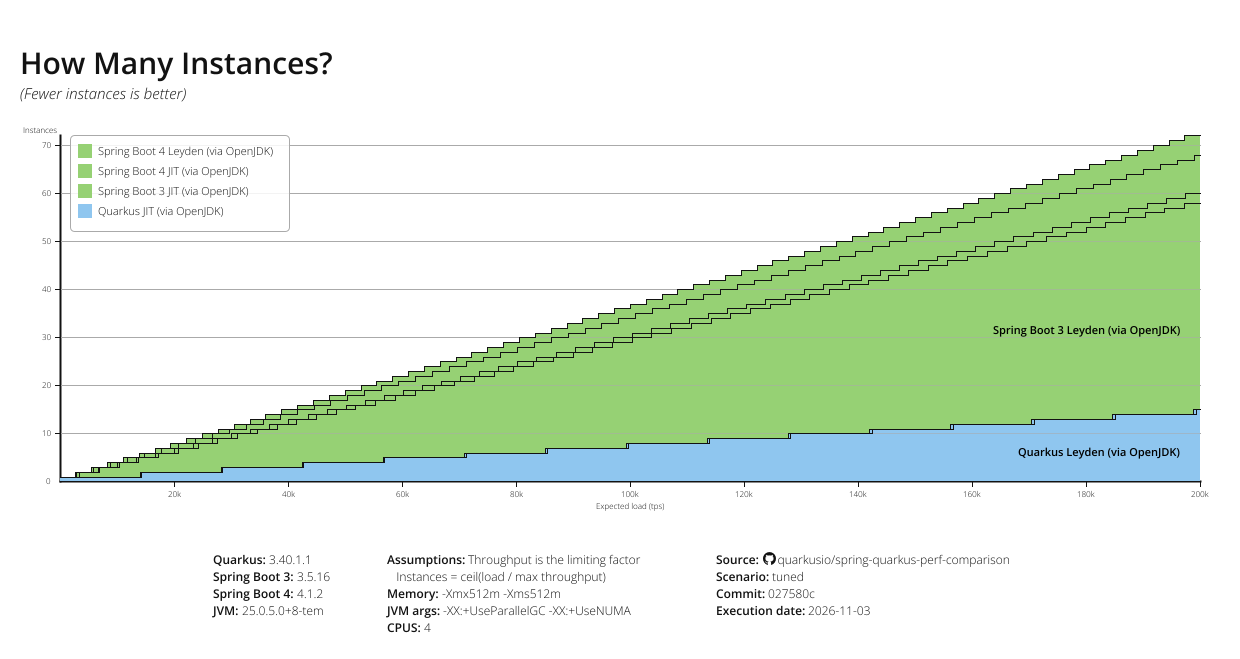
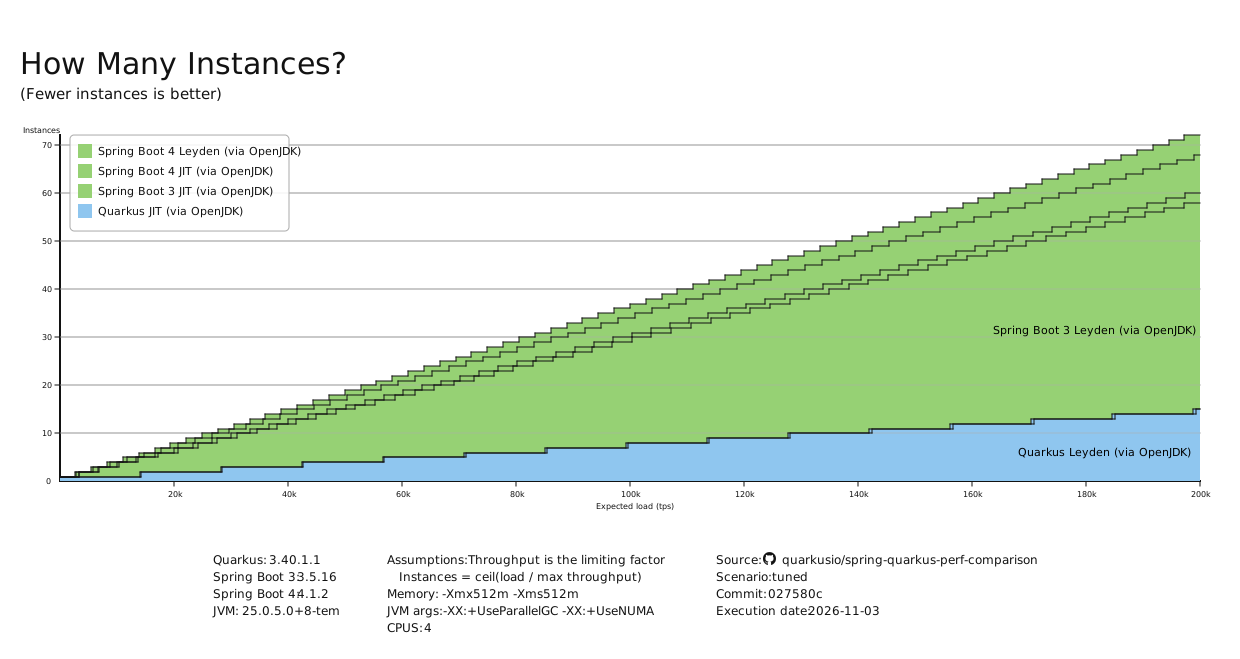
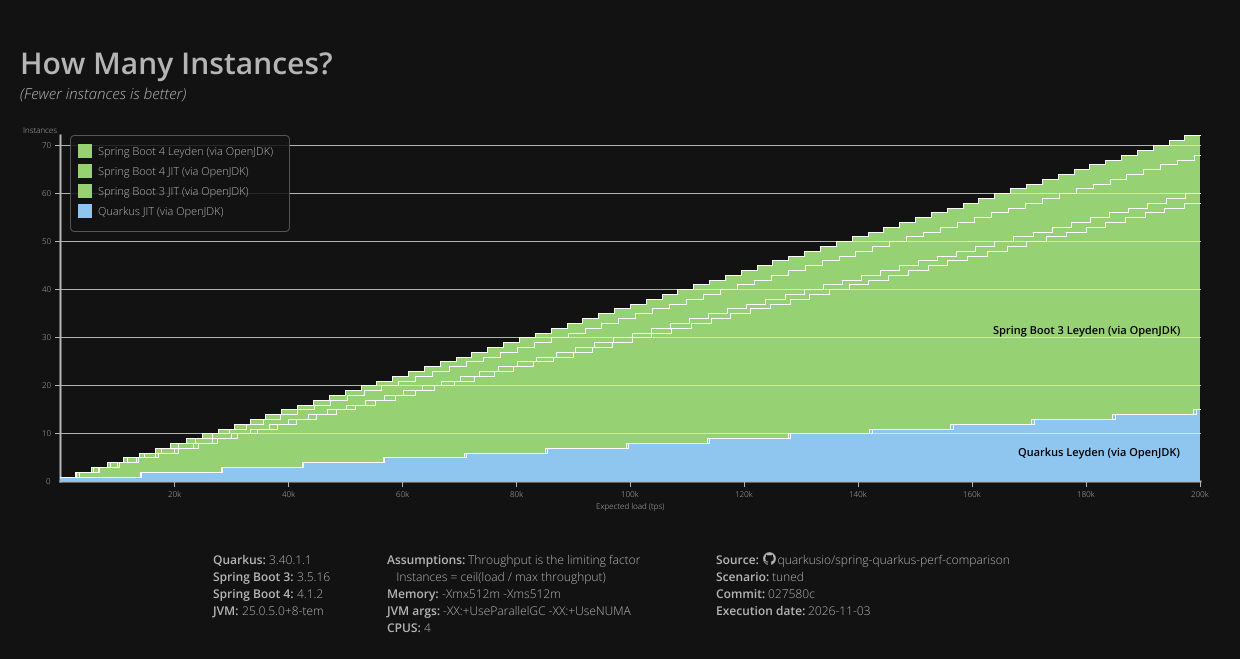
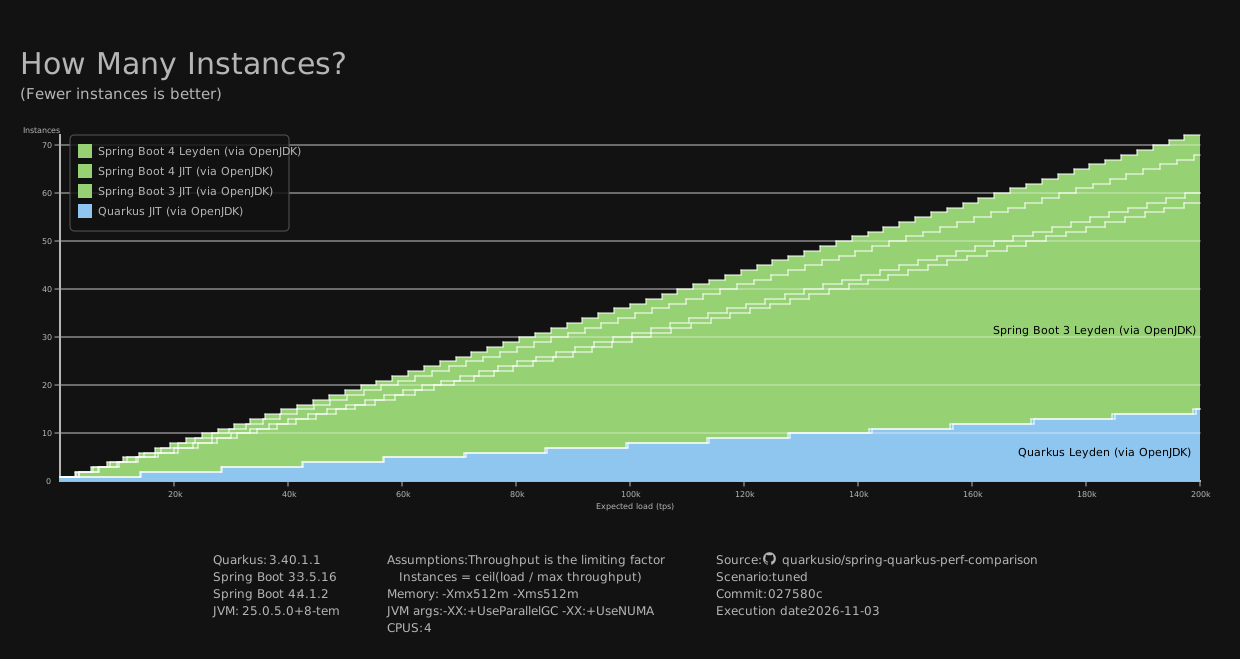


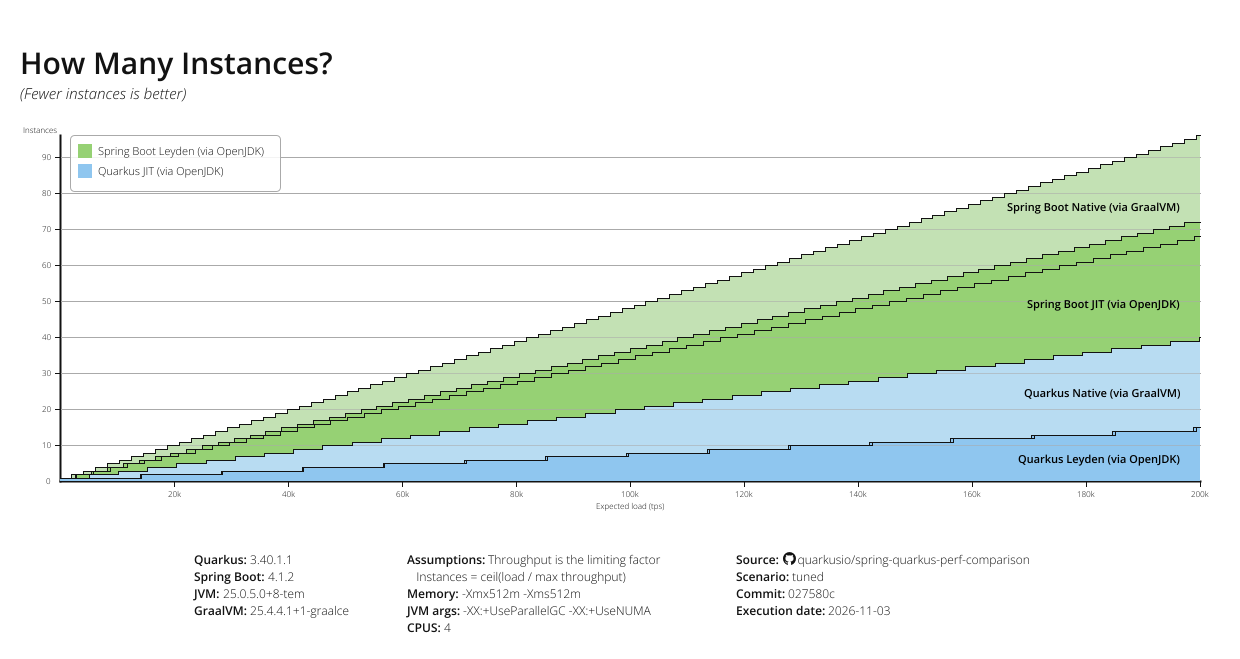
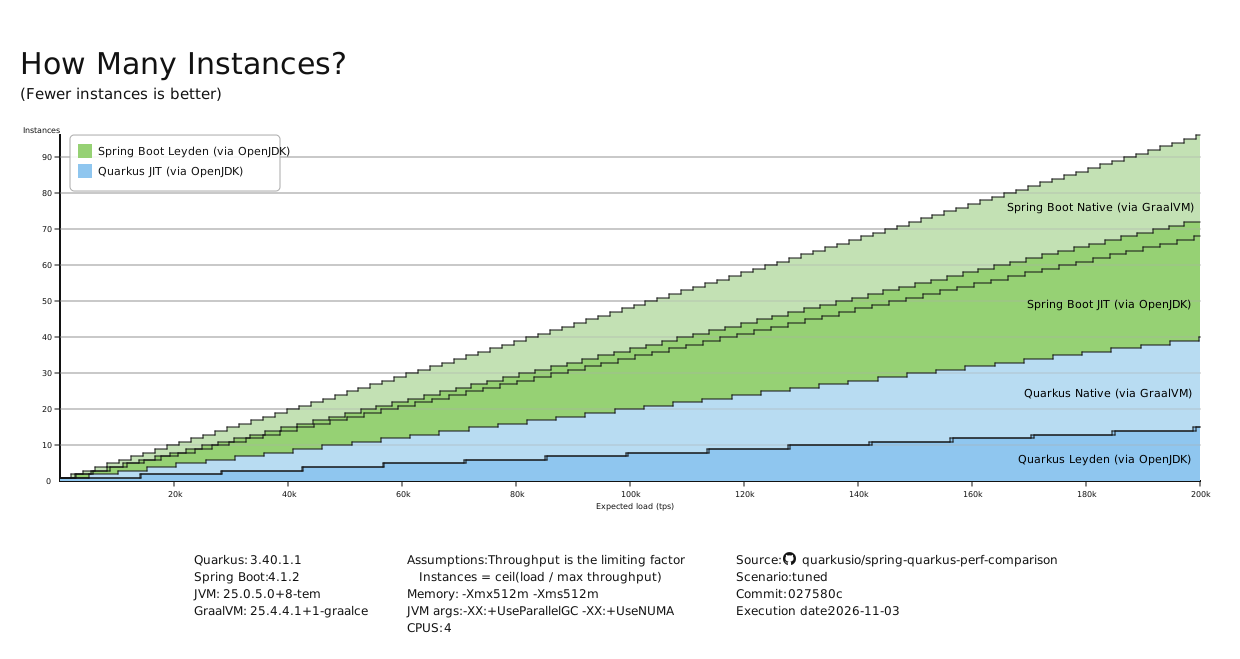
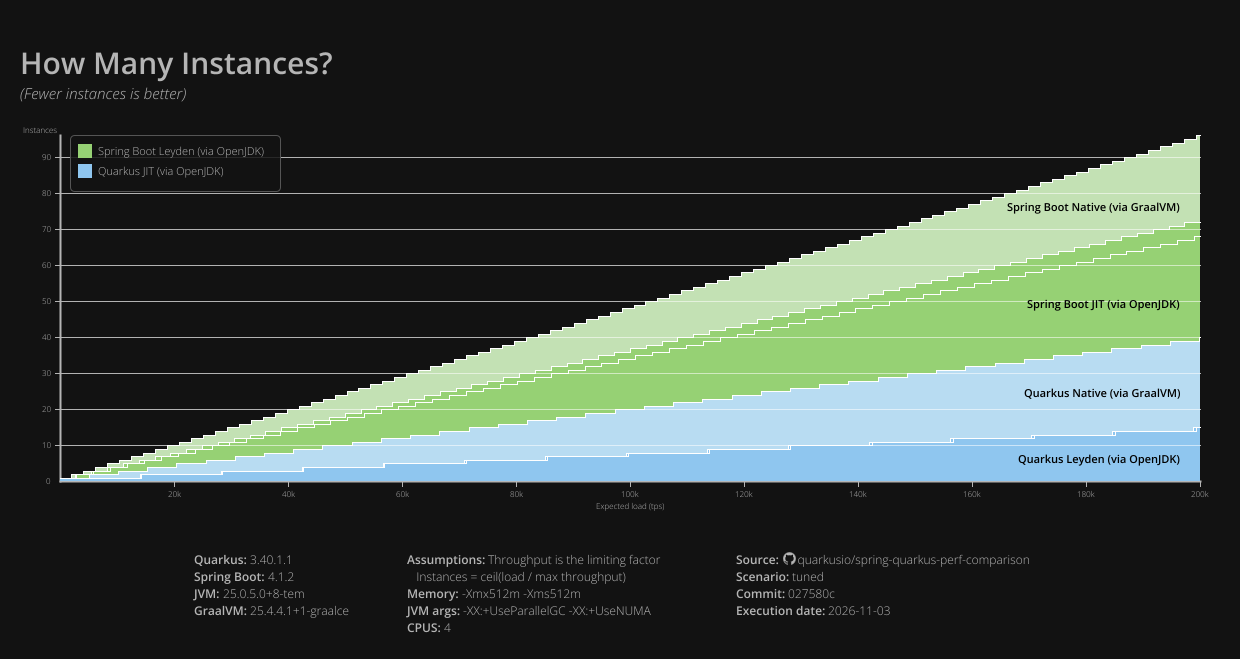
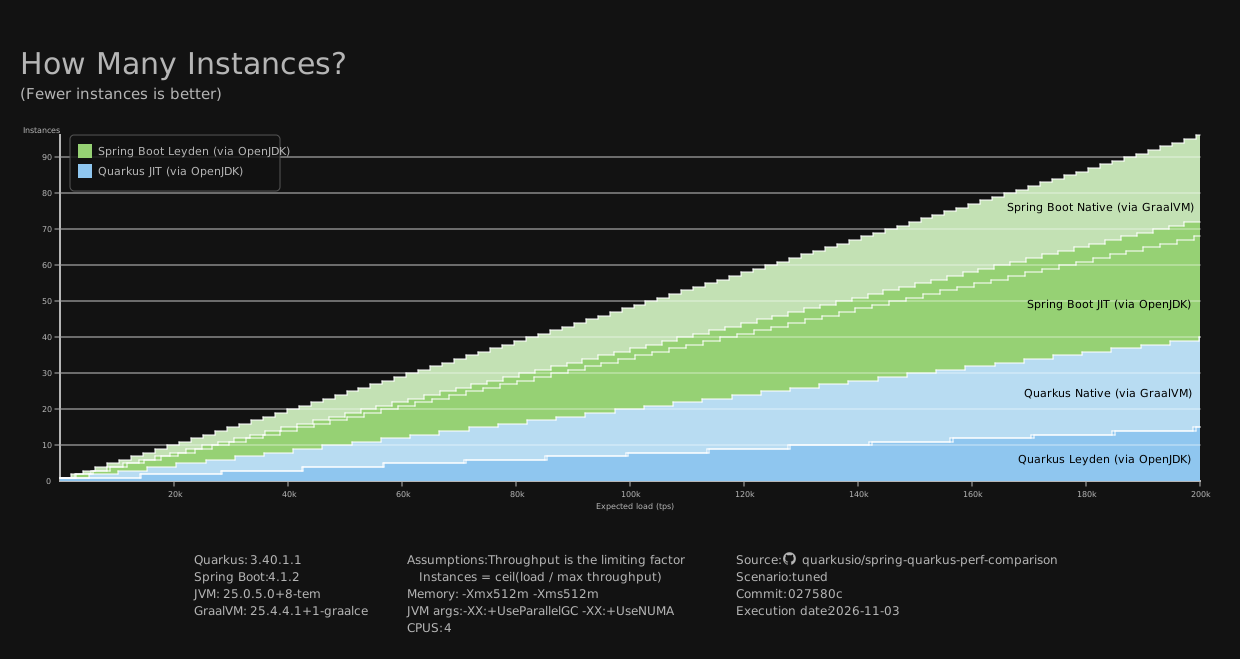


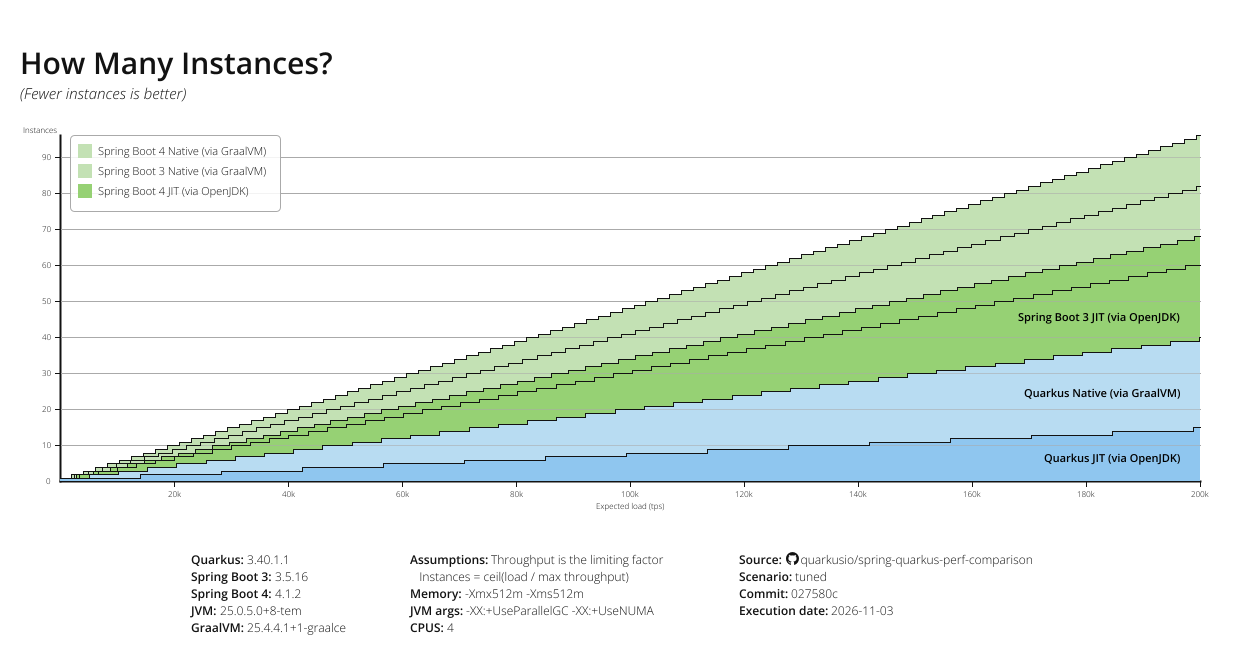
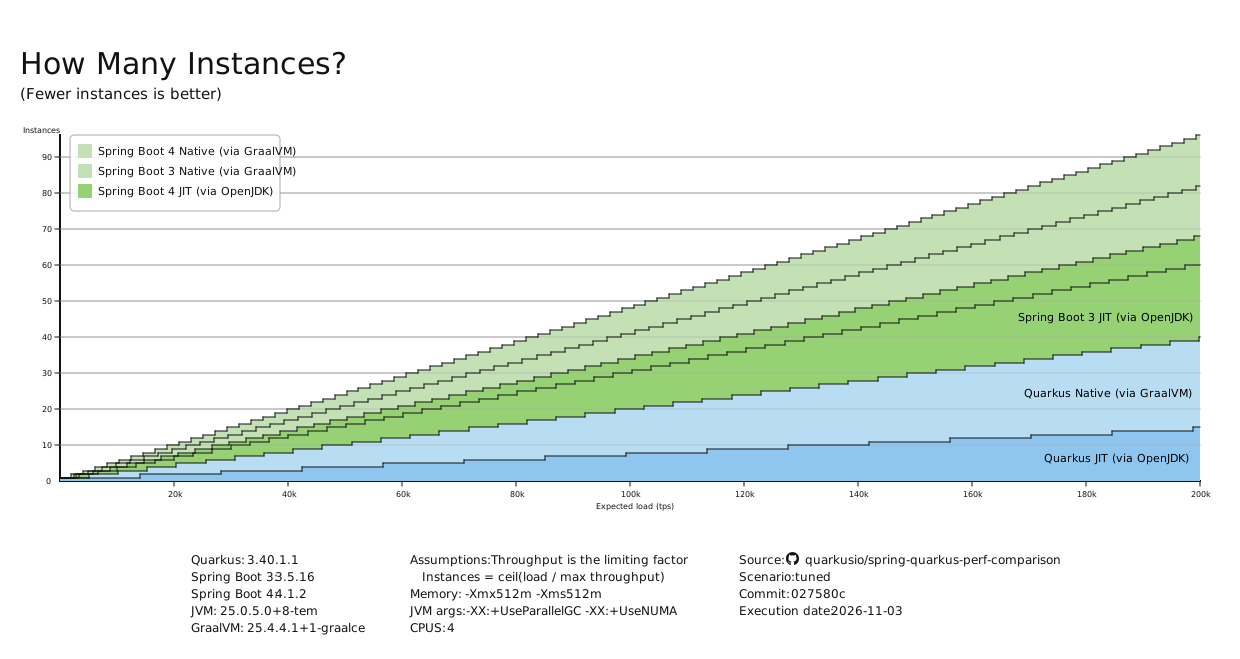
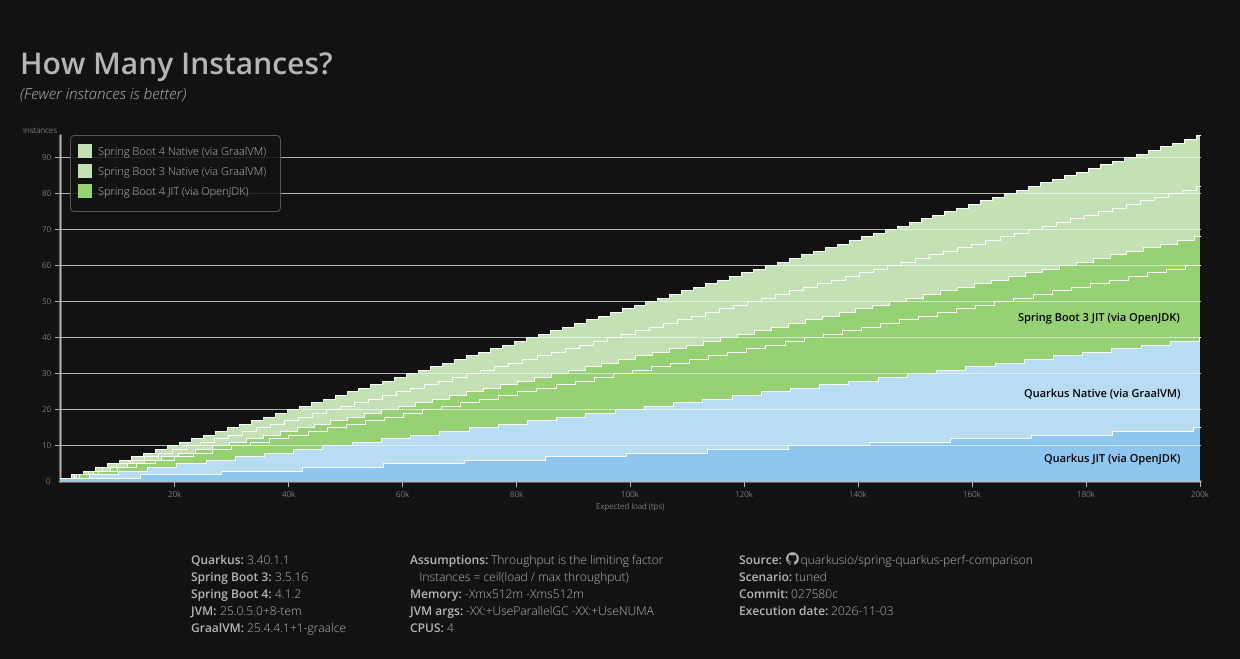
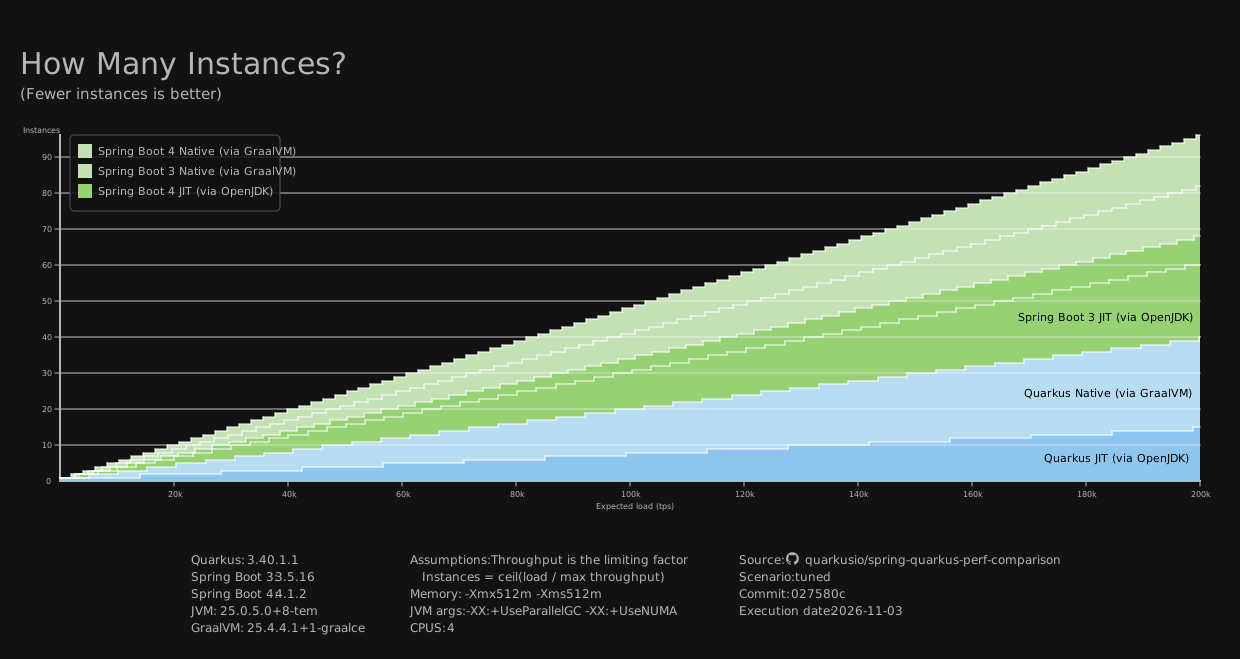


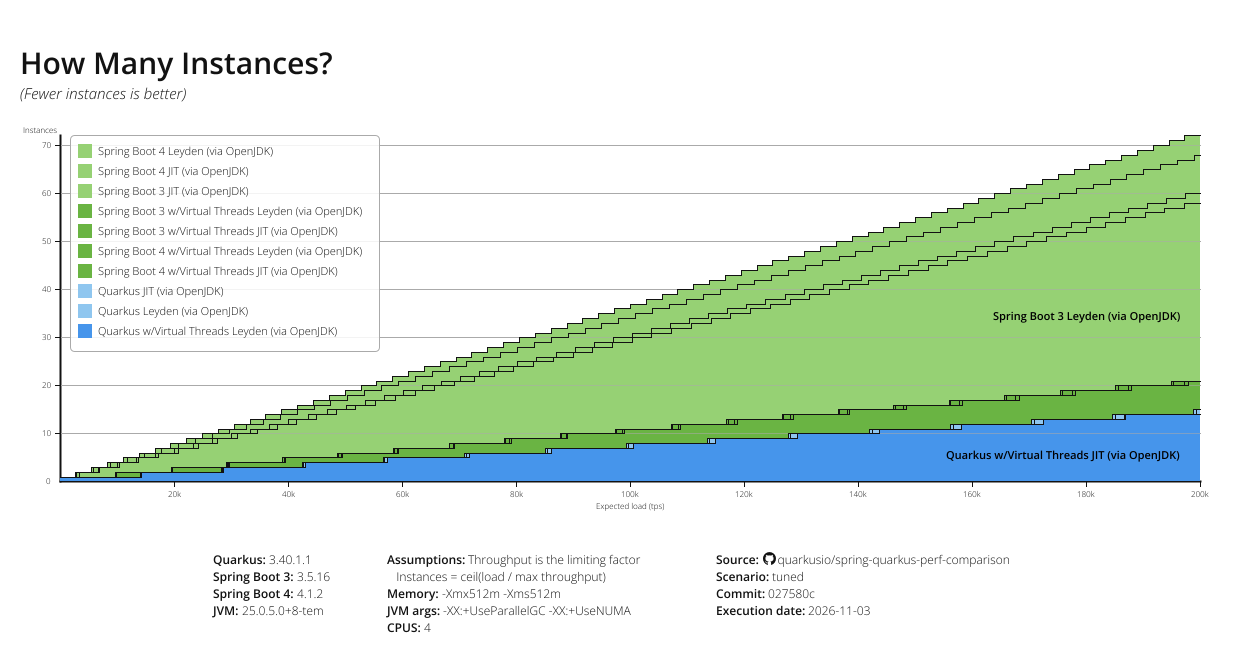
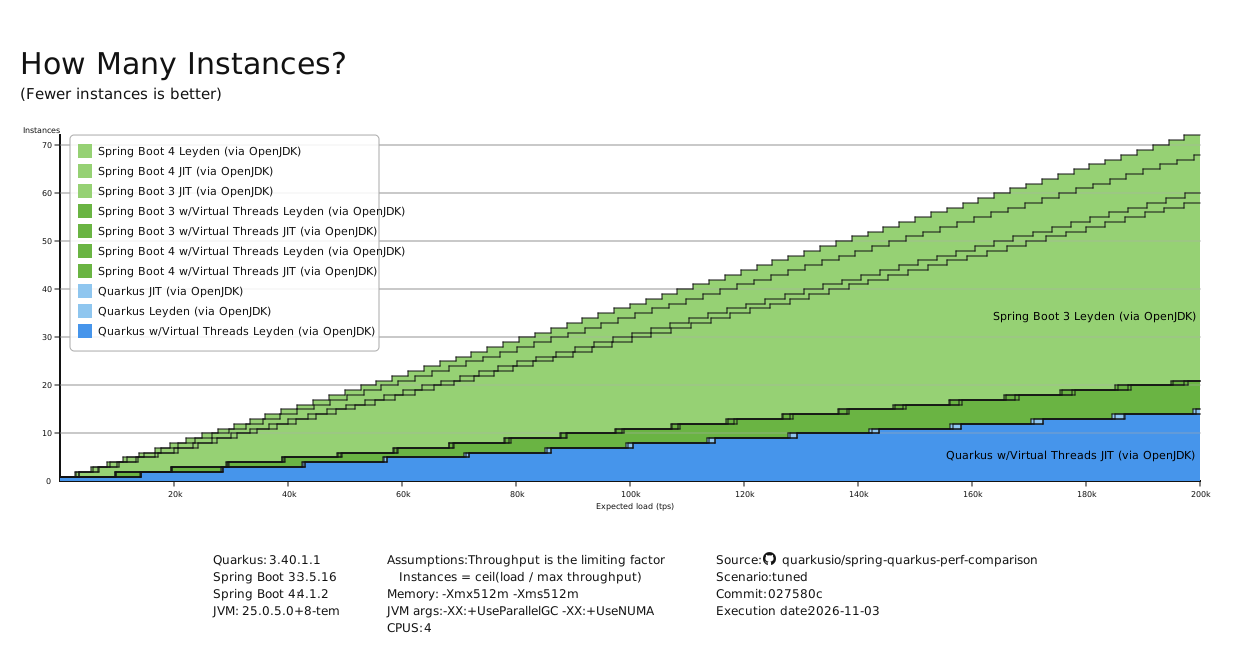
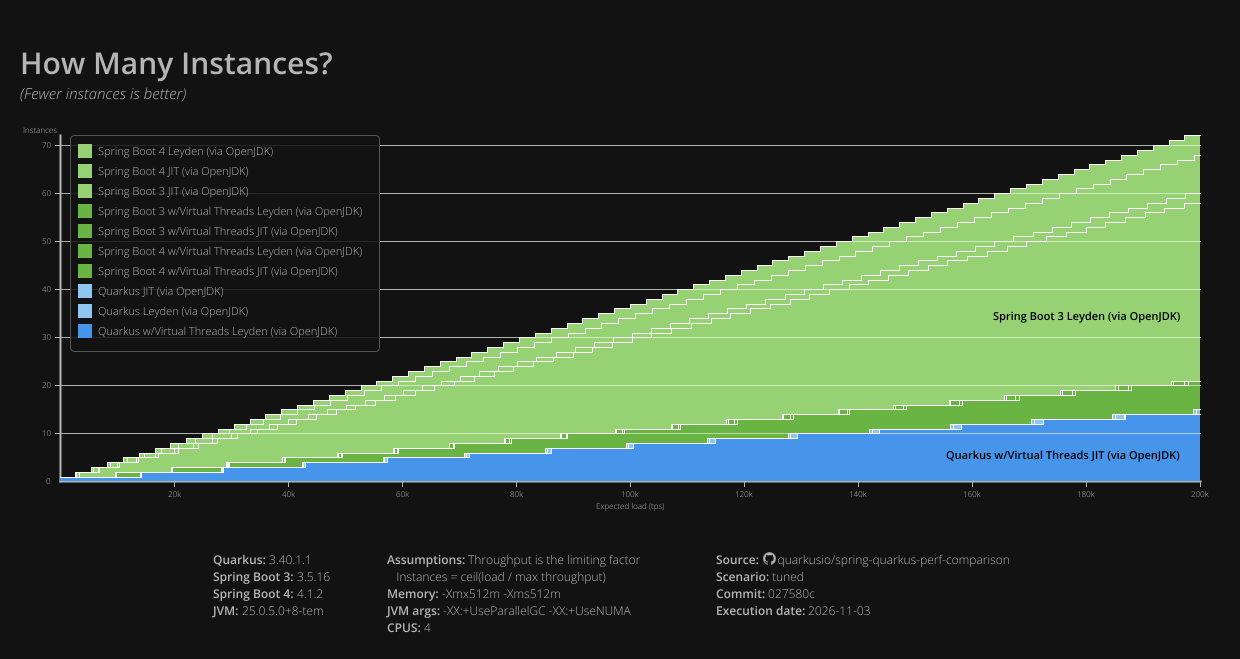
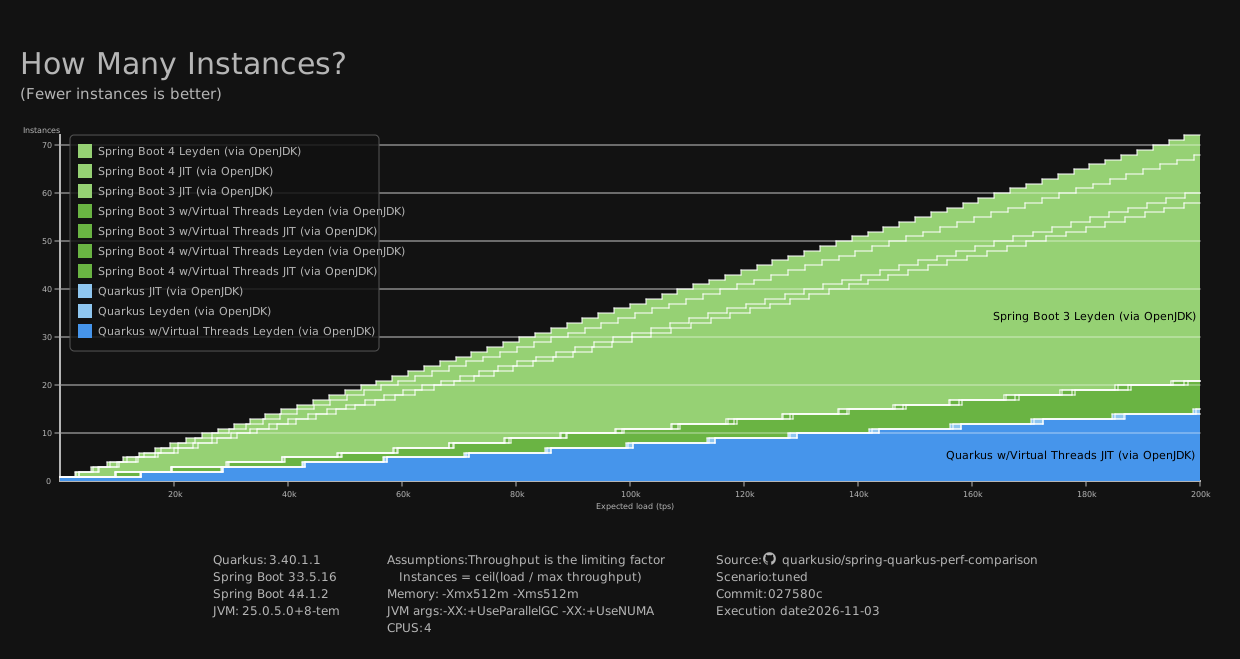


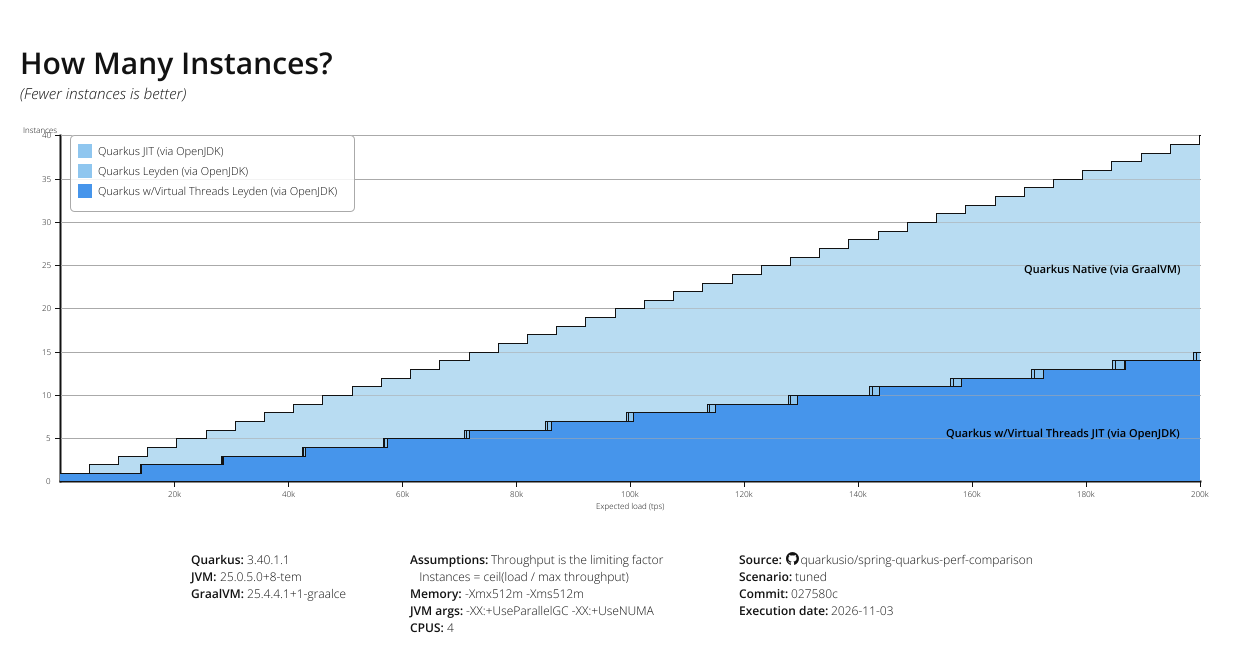
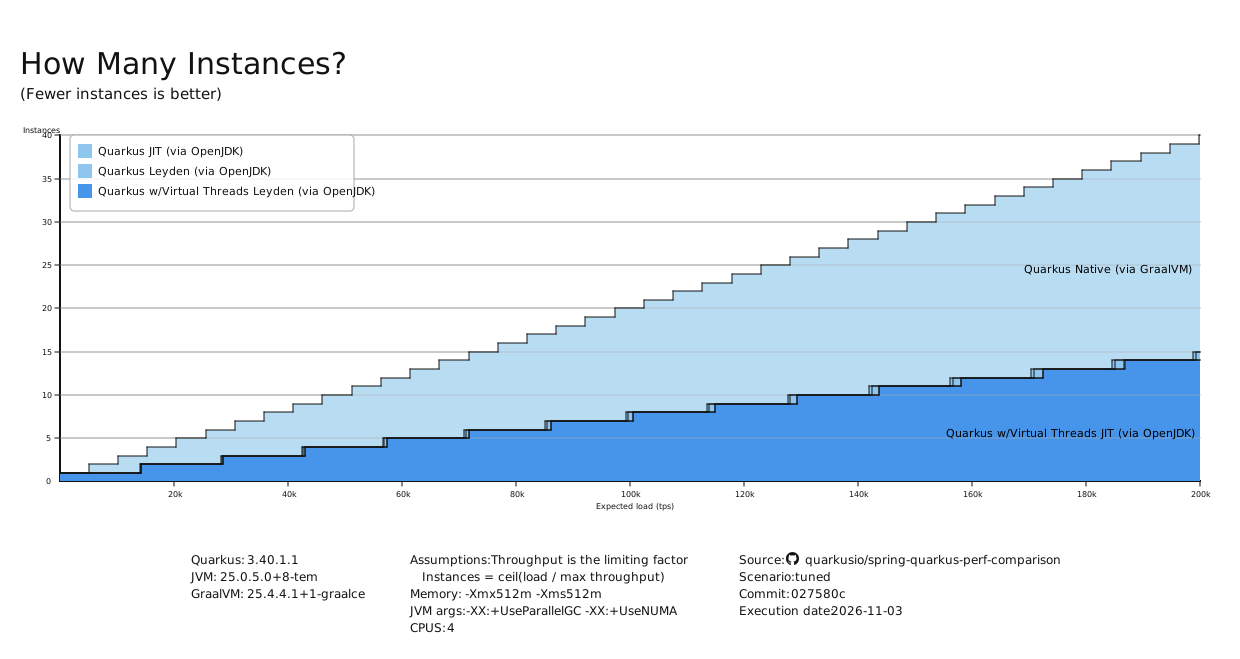
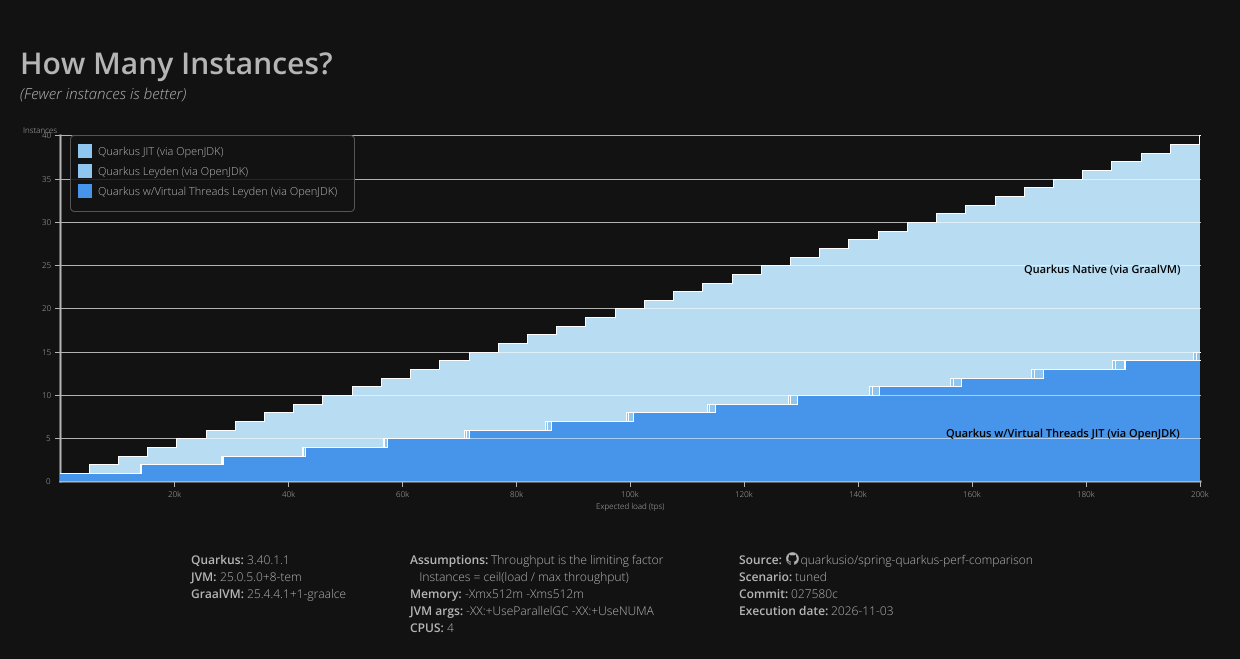
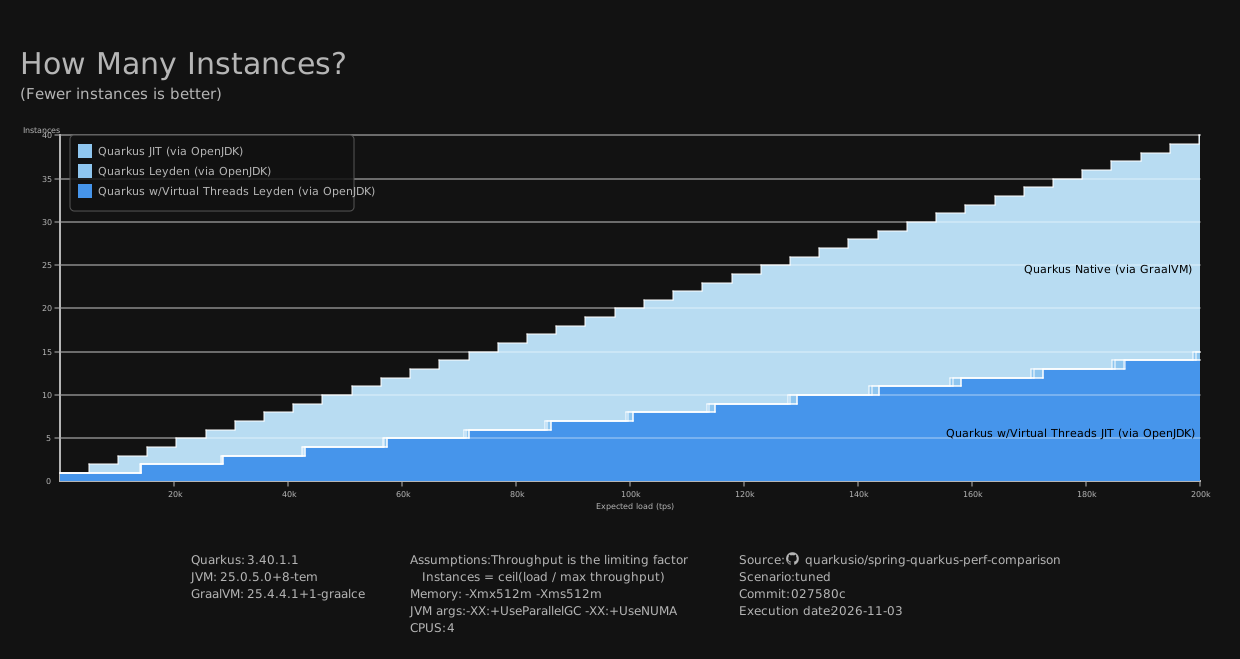


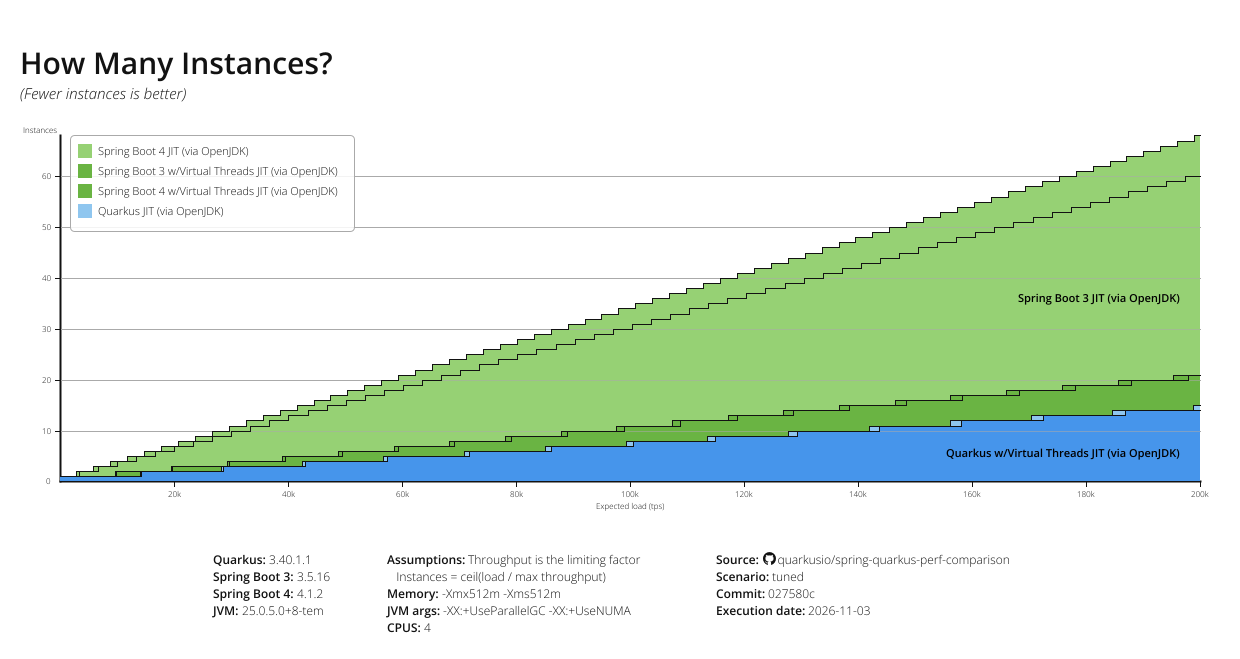
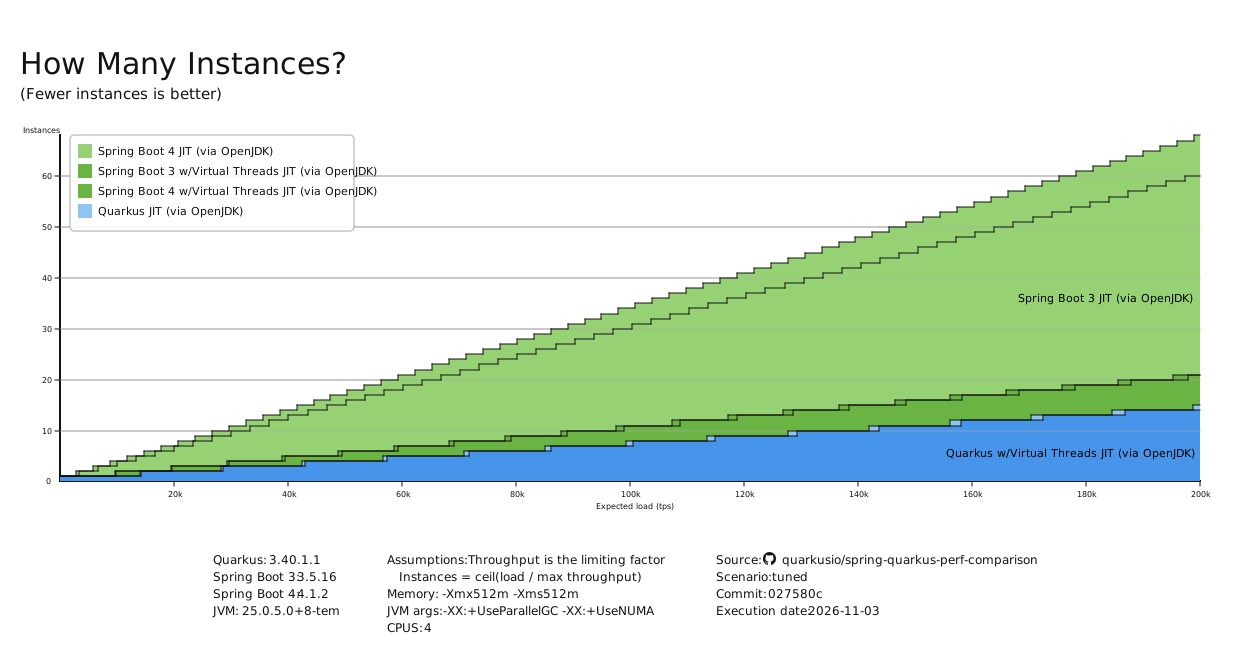
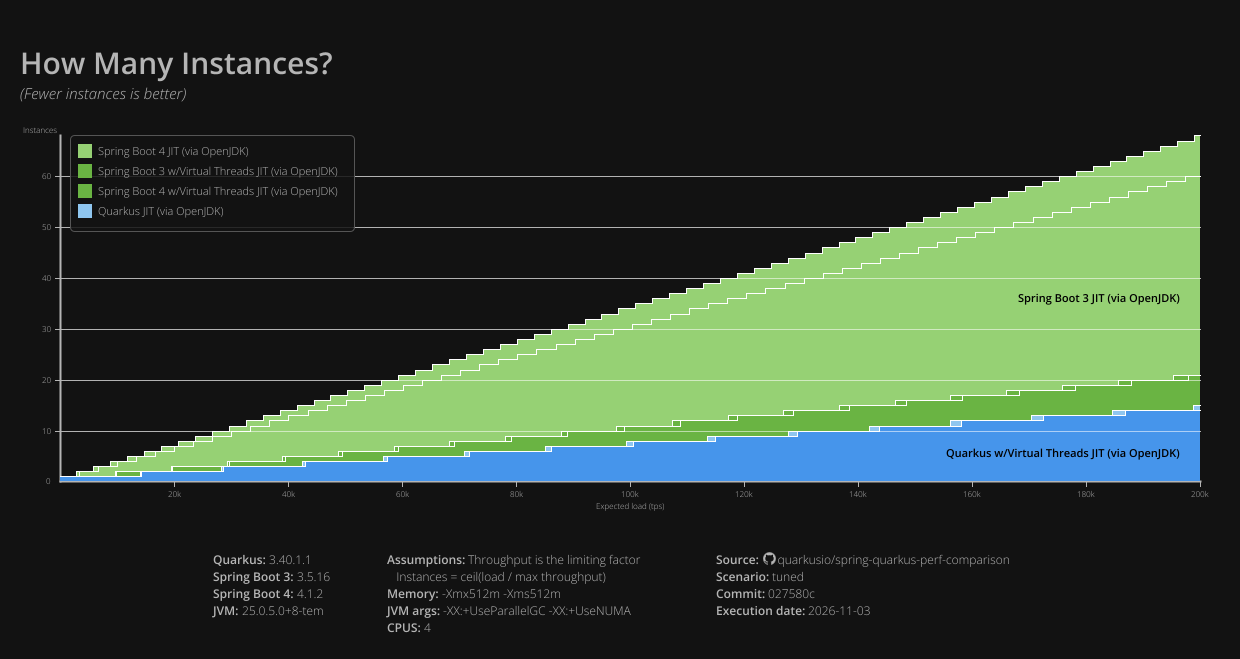
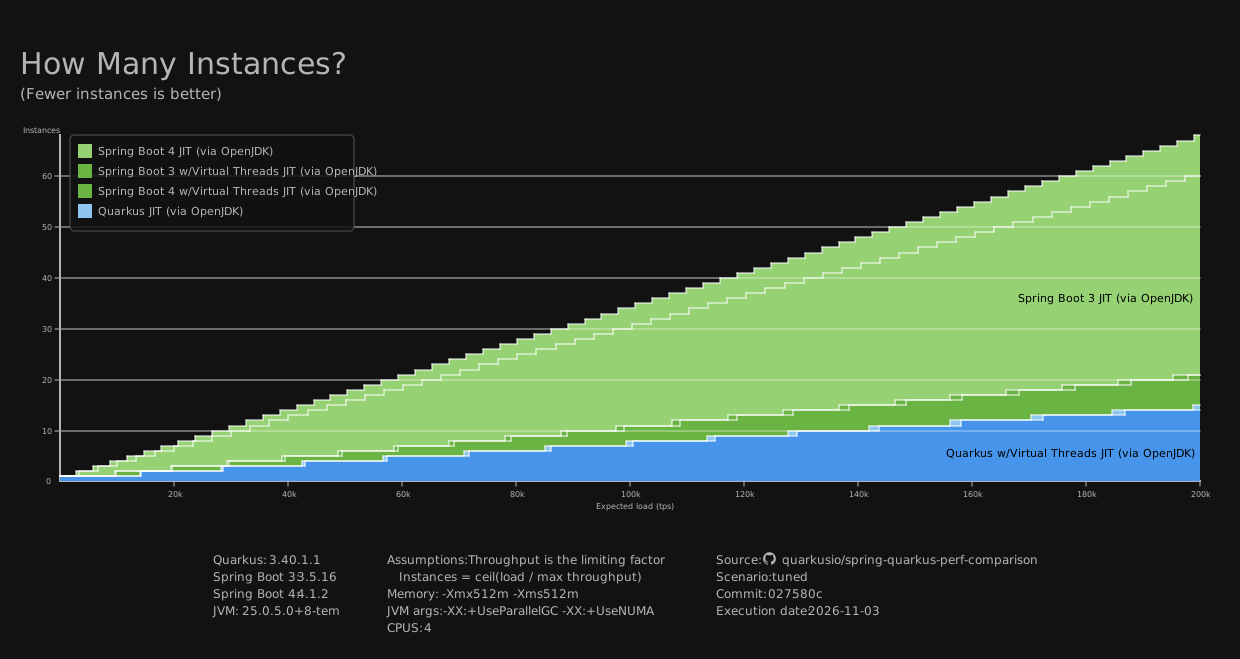
Note: All URLs follow the pattern https://quarkus.io/benchmarks/tuned/spring-quarkus-perf-comparison-latest-tuned-{metric}-for-{group}-{theme}.{format} where metric is one of: throughput, boot-and-first-response-time, memory-rss, build-duration, composite, density-by-rss, or load-density.