



Austrian fuel prices in Home Assistant, from E-Control's Spritpreisrechner. You get the five cheapest stations near you for Diesel, Super 95 and CNG, as sensors and on a card.
 |
 |
 |
| Lovelace card | Card editor | Config flow |
- One price sensor per fuel type, carrying the five cheapest nearby stations with opening hours, payment methods and distance.
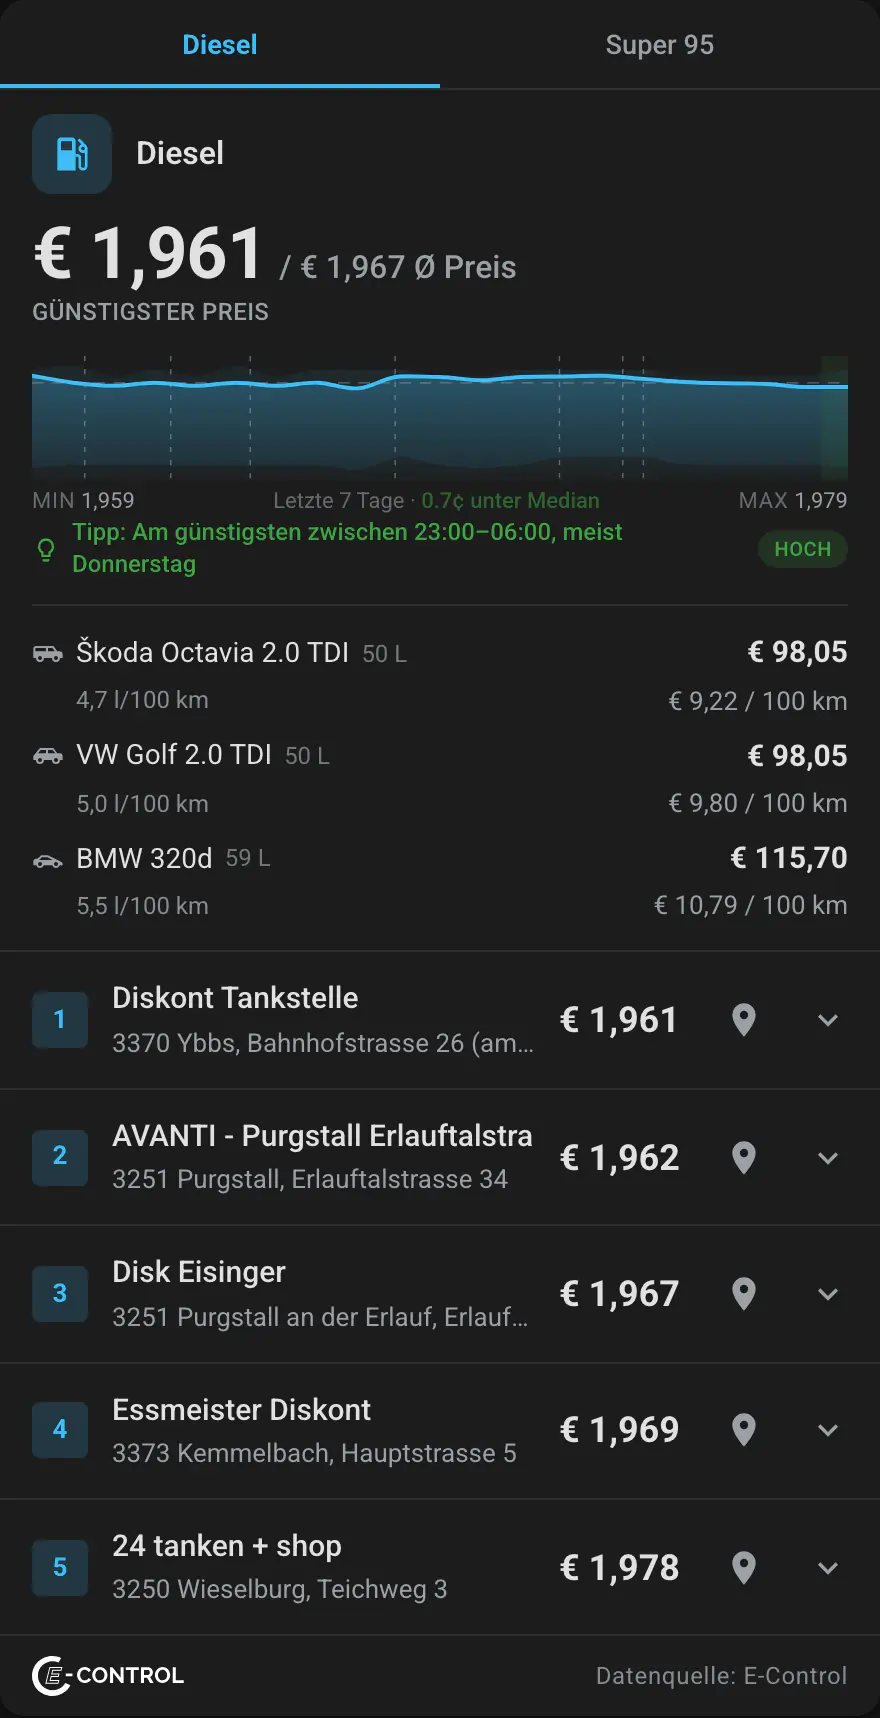
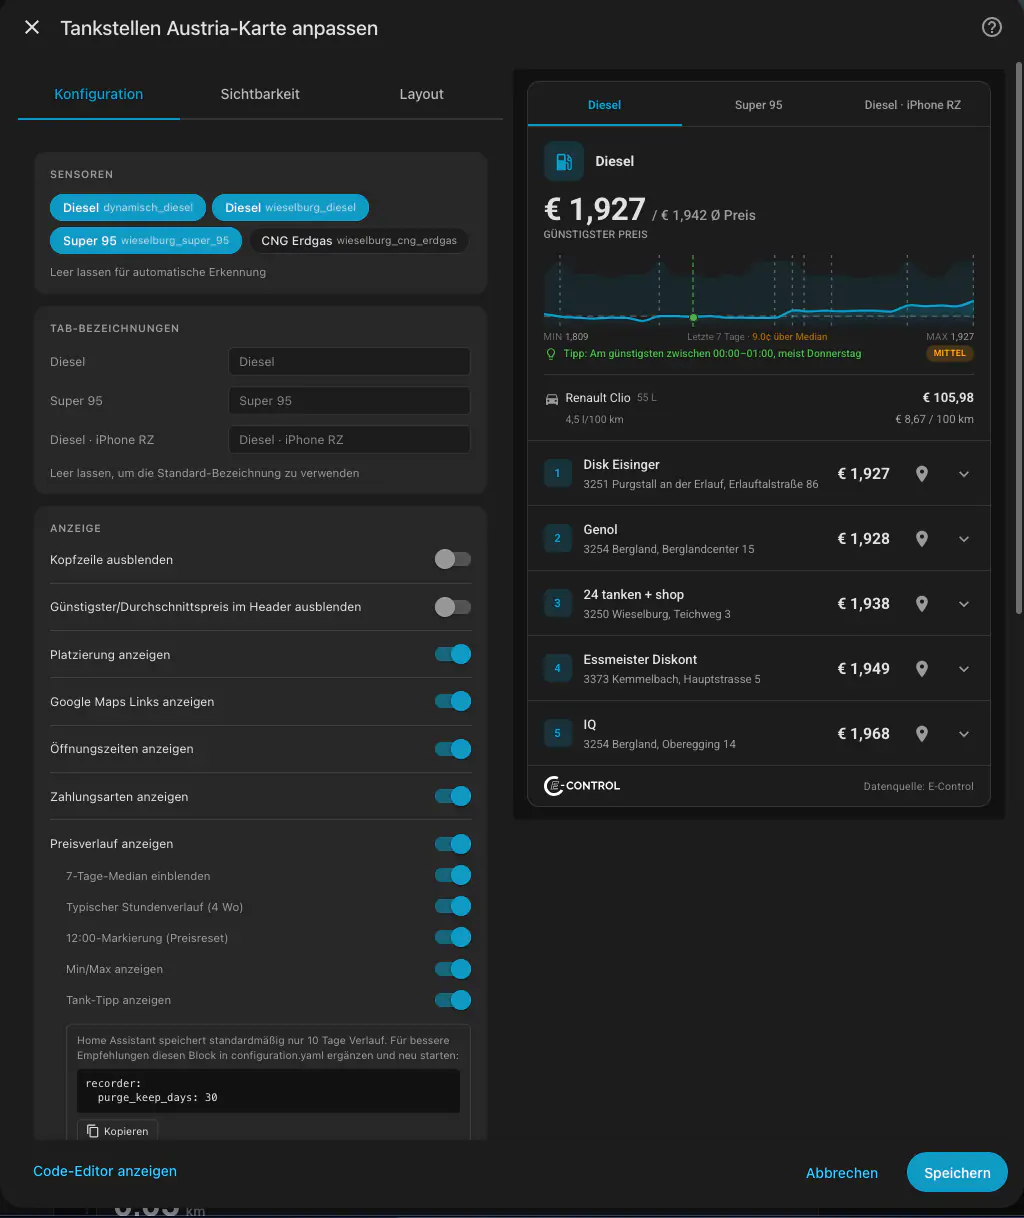
- A card with a tab per fuel type, brand-coloured station details, navigation links, a seven-day chart and a visual editor, in German and English.
- A best-time-to-refuel tip worked out from up to four weeks of your price history, marked on the chart and available as sensors for automations.
- Prices that follow your phone or car as you drive, with fixed and moving locations side by side.
- Show only the stations that take your card, or highlight them, and see which stations are closed or closing soon.
- Fill-up cost per car at the cheapest station, with the cost per 100 km.
- Optional long-term statistics, so price charts can span months instead of days.
- A Repairs notice that tells you when E-Control's service is down, so you know your setup is fine.
- Home Assistant 2026.3.0 or newer.
- No account and no API key.
The Marketplace is HACS, built into Home Assistant since 2026.11.
- In Home Assistant, go to Settings → Marketplace and search for Tankstellen Austria.
- Select it, then select Install. The setup starts right away, no restart needed.

On Home Assistant older than 2026.11, use HACS instead: search for Tankstellen Austria, select Download, then restart Home Assistant.
- Download
tankstellen_austria.zipfrom the latest release. - Unzip it into
config/custom_components/tankstellen_austria/. - Restart Home Assistant.

- Go to Settings → Devices & services → Add integration and select Tankstellen Austria.
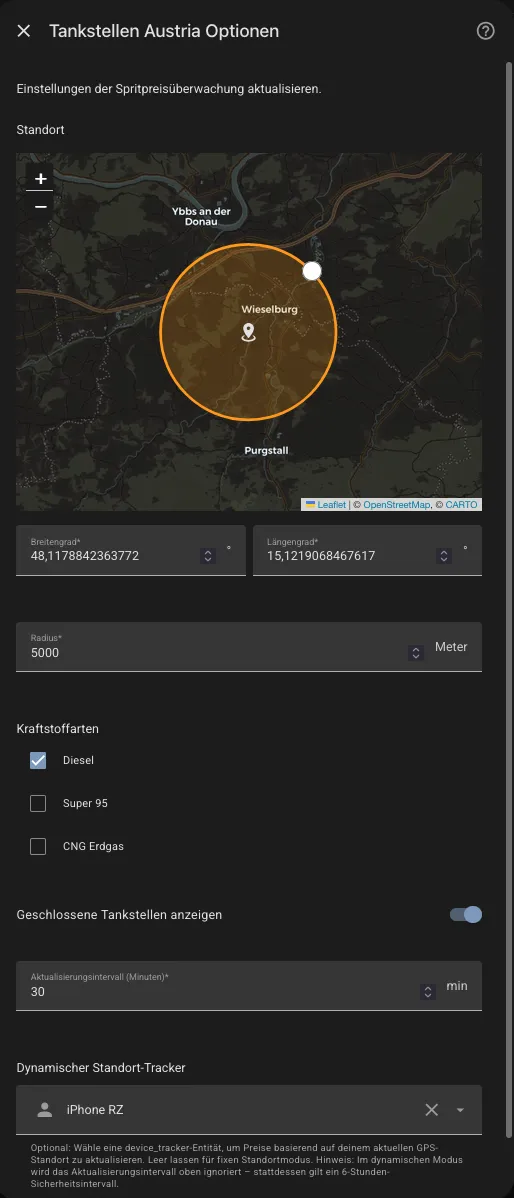
- Pick your location on the map and the fuel types you want.
- To have prices follow you, select a tracker under Dynamic location tracker. Leave it empty for a fixed location.
- Select Submit. The integration checks that E-Control answers, then creates one sensor per fuel type.
Add one entry per place you care about, such as home, work and your phone.
| Field | Default | Description |
|---|---|---|
| Name | Tankstellen | Device name; the entity IDs are built from it. |
| Location | your home location | Where to search from. Ignored while a tracker is set. |
| Fuel types | Diesel, Super 95 | Any of Diesel, Super 95 and CNG Erdgas. At least one. |
| Include closed stations | on | Also list stations that are closed right now. |
| Update interval (minutes) | 30 | 10 to 720, in steps of 5. Ignored in dynamic mode. |
| Long-term statistics | off | Record hourly minimum, maximum and average prices (see Entities). |
| Dynamic location tracker | empty | A device_tracker whose position replaces the fixed location (see Data updates). |
Settings → Devices & services → Tankstellen Austria → Configure opens the same fields as setup, without Name. ⋮ → Reconfigure offers the same form. Saving reloads the entry; entity IDs and history stay.
| Field | What changes |
|---|---|
| Location | The search point for a fixed entry. |
| Fuel types | A new fuel type gets its sensor. A dropped one leaves its sensor unavailable until you delete it on the entity's settings page. |
| Include closed stations | Which stations the next update lists. |
| Update interval (minutes) | The cadence, from the reload on. |
| Long-term statistics | Turning it off leaves the recorded statistics in place (see Entities). |
| Dynamic location tracker | Switches the entry between fixed and dynamic mode. |
One sensor per fuel type you selected. The entry name is the device name, so an entry named "Home" with all three fuel types gives sensor.home_diesel, sensor.home_super_95 and sensor.home_cng_erdgas.
| Entity | State | Unit |
|---|---|---|
sensor.<entry name>_<fuel type> |
Cheapest price among the listed stations | €/l |
| Attribute | Description |
|---|---|
fuel_type |
DIE, SUP or GAS |
fuel_type_name |
Diesel, Super 95 or CNG Erdgas |
station_count |
Number of stations in stations (at most 5) |
average_price |
Average price of the listed stations, not a regional average |
stations |
One entry per station, cheapest first: id, name, price, open, location (address and coordinates), distance_m (metres, as the crow flies), opening_hours, payment_methods. Not stored in the recorder history. |
dynamic_mode |
true when the entry follows a tracker |
dynamic_tracker_label |
Friendly name of the tracker, in dynamic mode only. The tracker's entity ID is not exposed. |
attribution |
See Attribution |
payment_methods holds cash, debit_card and credit_card as booleans, and others as a list of the strings E-Control sends, such as Austrocard or UTA.
Two more entities per fuel type carry the card's refuel tip, so an automation can use it. They compute the same window from the same 28 days of history, so the card and the entities agree.
| Entity | State |
|---|---|
binary_sensor.<entry name>_<fuel type>_cheap_window |
on during the cheapest hours of the day |
sensor.<entry name>_<fuel type>_next_cheap_window |
When the window opens next (timestamp) |
Both are unknown until there are 7 days of history, and also when no time of day is cheaper than the rest, as with CNG prices that never move; the binary sensor's fact attributes stay filled then. They are unavailable when the recorder isn't running. Neither exists in dynamic mode, where the card hides its tip too. The binary sensor's attributes:
| Attribute | Description |
|---|---|
start_hour, end_hour |
The window in local hours. end_hour is exclusive and can be smaller than start_hour when the window crosses midnight. |
alt_start_hour, alt_end_hour |
A second run of hours about as cheap as the window, otherwise null. The binary sensor is on in both. |
weekday |
The cheapest weekday (monday … sunday) when its lead is statistically significant, otherwise null |
confidence |
high, medium or low, as on the card's badge |
confidence_score, span_days, gap_cents, consistency_pct |
What the confidence is made of (see How the window is computed). Not stored in the recorder history. |
daily_range_cents |
How much the price moves over a typical day: the median of the daily high minus low over four weeks |
noon_days, noon_rise_days, noon_rise_cents |
On how many observed days the price rose at noon, and by how much on average. Not stored in the recorder history. |
The facts are there with 7 days of history even when there is no window and the state is unknown.
Off by default. Without it, the sensors keep only state history, which the recorder purges after purge_keep_days (10 by default). With it on, Home Assistant also records hourly minimum, maximum and average prices, and those survive the purge. The refuel tip on the card and the Cheap window entities use those hourly averages for the days the recorder has purged, so they see four weeks without a longer purge_keep_days, and the weekday test reads twelve.
Home Assistant pairs the monetary device class only with state_class: total, which makes no sense for a unit price. With statistics on, the sensors therefore drop device_class: monetary and use state_class: measurement. Entity IDs, unique IDs, attributes and the card stay the same.
When you turn it off again, the recorded statistics stay, and Home Assistant raises a repair saying the sensor "no longer has a state class". It links to Developer tools → Statistics, where you can delete them without touching the sensor.
Home Assistant loads the card for you on dashboards in storage mode, the default. For a YAML dashboard, add the resource yourself:
| URL | Type |
|---|---|
/tankstellen-austria/tankstellen-austria-card.js |
JavaScript module |
The minimal card finds every Tankstellen Austria sensor on its own:
type: custom:tankstellen-austria-cardThe visual editor covers every option. Options sit in groups, by the part of the card they change; the defaults below apply when you leave a key out. The card picker starts you with stations.distance on and stations.payment_mode: highlight.
type: custom:tankstellen-austria-card
entities:
  - sensor.home_diesel
  - sensor.home_super_95
stations:
  count: 3
  sort: distance
chart:
  median_line: true
cars:
  show: true
  items:
    - name: Golf
      fuel_type: DIE
      tank_size: 50
consumption: 5.8| Option | Default | Description |
|---|---|---|
entities |
all sensors | List of this integration's price sensors, one tab each |
language |
Home Assistant's | de or en |
tab_labels |
{} |
Your own tab label per entity |
stations
| Option | Default | Description |
|---|---|---|
count |
5 |
Stations to list, 0 to 5. 0 hides the list. |
index |
true |
Rank number per station. In the editor, switching it on turns brand off |
brand |
false |
The station's brand initials and colour in the tile, in place of the rank; works with index off, and the editor turns index off when you switch it on for the seventeen largest networks, about 83 % of Austria's stations: Enilive, Turmöl, BP, Lagerhaus/Genol, OMV, Shell, JET, Avanti, AVIA, SOCAR, Diskont at Hofer, DISK, Rumpold, F. Leitner, IQ and LM Energy; other stations get their initials on a grey tile. Colours only, no logos. |
tile_shape |
square |
The rank tile's shape: square (rounded corners) or circle; applies to the rank and the brand alike |
map_links |
true |
Navigation link per station |
map_provider |
auto |
auto (Apple Maps on iOS, the app chooser on Android, Google Maps elsewhere), google or apple |
distance |
false |
Distance under each station's price |
sort |
price |
price lists the cheapest first, distance the nearest |
opening_hours |
true |
Opening hours in the station details |
payment_methods |
true |
Payment methods in the station details |
payment_filter |
[] |
cash, debit_card, credit_card, or any string E-Control sends, such as Routex, UTA, DKV |
payment_mode |
filter |
filter hides the stations without a match, highlight shows them and highlights the matches |
header, chart, cars and footer
| Option | Default | Description |
|---|---|---|
header.show |
true |
The header |
header.price |
true |
The cheapest and average price in the header |
chart.show |
true |
Seven-day price chart |
chart.min_max |
true |
Minimum and maximum on the chart |
chart.median_line |
false |
Seven-day median line |
chart.hour_envelope |
false |
Typical price range per hour of day, over four weeks |
chart.noon_markers |
false |
Markers at the daily 12:00 price reset |
chart.best_refuel |
true |
Refuel tip and its band on the chart |
cars.show |
false |
Fill-up cost per car |
cars.fill_up / cars.consumption |
true / true |
Fill-up cost and cost per 100 km rows |
cars.items |
[] |
Each car: name, fuel_type (DIE, SUP or GAS), tank_size (1 to 200 l), optional consumption (l/100 km) and icon |
footer.show |
true |
The E-Control footer |
footer.adaptive_logo |
false |
Show the E-Control logo as a silhouette in your theme's colour |
Cards set up before v2.0.0
Older cards keep working: the card reads the flat options of v1 (max_stations, show_index, hide_header, cars as a list, …) as their grouped counterparts, and the visual editor saves them in the new shape the next time you change something. hide_header, hide_header_price and hide_attribution turn into header.show, header.price and footer.show with the opposite value; sort_by_distance and payment_highlight_mode into stations.sort and stations.payment_mode. Where a card has both, the grouped option wins.
The card, and the integration for the Cheap window entities, read up to four weeks of the sensor's history (again every 30 minutes) and look for the run of hours that is cheapest compared with the rest of each week. The window is as long as the data says: one hour when one hour stands out, most of the day when prices only jump at noon. When a price never moves, the card says so with the number that shows it, instead of naming a window. The window is drawn as a green band on the chart, a second band and "also …" appear when another time of day is about as cheap, a cheapest weekday is added only when it passes a significance test, and a High, Medium or Low confidence badge explains itself on hover.
Under the tip stand two counted facts, whatever the confidence: on how many of the observed days the price rose at noon and by how much on average ("Fill up before 12:00" when it was half of them or more), and whether today's price is lower or higher than most of the last four weeks. Both describe the history and forecast nothing.
Home Assistant keeps 10 days of history by default, which caps the confidence at Medium. Keep more, or turn on Long-term statistics (the hourly averages fill the purged days):
# configuration.yaml
recorder:
  purge_keep_days: 30
The tip follows the cheapest nearby station at each moment, not any one station's pattern. "21:00–03:00" can mean one station drops in the evening and another is cheap at midnight.
How the window is computed
Austrian law lets stations raise prices once a day at 12:00 and lower them at any time. The sensor is the cheapest of up to five stations, so its history mixes every station's noon rise, every evening drop and the cheapest station changing. The card pulls the time-of-day signal out in six steps:
- Duration-weighted chunks. Each price interval is split at every hour boundary, and each hour-of-day and weekday bucket is credited by the time the price was active in it. A rise at 12:14 counts for 46 minutes of the 12:00 hour, not all of it.
- Weekly clipping. Values outside the 5th to 95th percentile of each Monday-aligned week are clipped, which removes glitches and keeps the noon spike from skewing the weekly mean.
- Weekly normalisation. Each chunk becomes its price minus that week's mean, so the weekly low wins whatever the price level.
- Separate buckets. The differences go into 24 hour-of-day and 7 weekday buckets, kept apart.
- Weighted median per bucket. Weights are duration times recency, with a half-life of 14 days.
- Window growth. Starting from the bucket with the lowest median, the window takes in every neighbouring hour within about 0.5 cent per litre of it, with no length cap. If that reaches all 24 hours there is no window. A second run of hours within the same tolerance becomes the second window.
Confidence is the average of two parts, scaled by a third. The parts are how much of the 28 days the history spans, and the window's lead: the median of the hours outside the window minus the median inside, against a 1.5 cent reference. The scale is how reliably the window beat its own day, the share of window time at or below that day's median price. Noise with no daily pattern sits near 50 % there and scores Low whatever its lead looks like; a pattern that holds every day sits near 100 %. High needs a score of 0.75, Medium 0.5. A second window caps the badge at Medium, since a day of history can swap which run is named first.
The weekday is named when the cheapest weekday's lead over the typical weekday is at least 0.5 cent and a permutation test, which shuffles the weekday labels of the days 200 times, finds a lead that large in at most 5 % of shuffles. With four weeks every weekday rests on about four days, so only a clear effect gets through. With Long-term statistics on, the weekday test reads twelve weeks; the window, the badge and the facts stay on the last four.
A fixed entry polls E-Control at its Update interval (minutes), every 30 minutes by default. The form doesn't go below 10 minutes, the informal limit for this API. Each update makes one request per fuel type.
- Around noon (about 12:05 to 12:07 Vienna time) E-Control sometimes answers with no stations while it refreshes. The sensors keep their values and the integration tries once more after 10 minutes.
- When one fuel type fails, the others update and the failed one keeps its last value. The entry goes unavailable only when every fuel type fails.
- When updates keep failing, the interval doubles from the second failure in a row, up to 12 hours, and returns to normal after the next success. After at least two failures over 10 minutes or more, a Repairs issue says E-Control isn't sending prices, and it clears itself once prices return.
- During E-Control maintenance the entries go unavailable and the card says why. One check every 10 minutes serves all entries, and prices return with the next update once the service is back.
With a Dynamic location tracker set, the entry searches around the tracker's position instead of the fixed location. An update runs when the tracker moves, if all of these allow it:
| Guard | Value | Purpose |
|---|---|---|
| Distance | 1.5 km | Ignores parking and walking drift |
| Per-entry cooldown | 10 minutes | At most one update per entry in that time |
| Cooldown across all entries | 5 minutes | Spaces out several dynamic entries |
| Safety-net poll | 6 hours | Keeps data fresh when the tracker stops reporting; replaces the update interval |
When the tracker has no position, the entry searches around your Home Assistant home location and raises the Repairs issue Location tracker unavailable. Outside Austria E-Control returns no stations, so the sensors keep their last values.
On the card, a dynamic tab is labelled with the tracker, such as Diesel · iPhone. The header shows when prices were last updated instead of the cheapest price, and a refresh button fetches new prices at once; it pauses for 2 minutes after each press. The price chart and refuel tip are hidden, since history from changing places doesn't compare.
- Get a notification when the cheapest Diesel drops below your target.
- Follow prices on a road trip with a dynamic entry on your phone.
- Compare home and work with two fixed entries, side by side on one card.
- Track a favourite station with a template sensor, as below.
Notify when the cheapest Diesel drops below 1.50 €/l:
alias: "Notify on cheap Diesel"
triggers:
  - trigger: numeric_state
    entity_id: sensor.home_diesel
    below: 1.50
actions:
  - action: notify.mobile_app_phone
    data:
      title: "Cheap Diesel nearby"
      message: >
        {{ state_attr('sensor.home_diesel', 'stations')[0].name }}
        — {{ states('sensor.home_diesel') }} €/l
Track the price of one favourite station
Template sensors go into configuration.yaml under a top-level template: key; restart after editing.
template:
  - sensor:
      - name: "Favourite station Diesel"
        unit_of_measurement: "€/l"
        state: >
          {{ state_attr('sensor.home_diesel', 'stations')
             | selectattr('name', 'search', 'Essmeister')
             | map(attribute='price') | list | first | default(none) }}
The station is only in stations while it is among the five cheapest, so the sensor is unavailable for the updates where it isn't. Keep | default(none): returning the string 'unavailable' fails the numeric unit check.
The same works without YAML: go to Settings → Devices & services → Helpers → Create helper → Template → Template a sensor, paste the state expression above, and set Unit of measurement to €/l. Set State class to measurement if you want history graphs. No restart needed.
- Stations in Austria only.
- At most five stations per fuel type, and only stations that report a price.
- The refuel tip needs at least 7 days of history and gets better up to 28. It works in whole hours and doesn't treat public holidays separately. With four weeks of history a weekday effect under about 3 cents is usually not detected; twelve weeks of long-term statistics catch smaller ones.
- Long-term statistics record whatever the entry watches. In dynamic mode that area moves with you, so the series mixes places.
-
"Cannot connect to the E-Control API" during setup. Usually a short network problem; try again. Check that your Home Assistant host can reach
https://api.e-control.at. -
Sensors unavailable shortly after 12:00. E-Control's daily refresh; see Data updates.
-
"E-Control is down for maintenance". Nothing to fix on your side. The integration keeps checking and recovers on its own.
-
The card says Can't reach E-Control. The last update failed, or none has worked since Home Assistant started. If Settings → Repairs shows E-Control isn't sending fuel prices, the fault is on E-Control's side and prices return on their own. If not, check that your host can reach the internet.
-
Repairs shows Location tracker unavailable. The tracker is gone or has no position. Restore it, or use ⋮ → Reconfigure to pick another tracker or none.
-
The card is missing from the card picker. On a YAML dashboard, add the resource yourself; see Cards.
-
Diagnostics for a bug report. Go to Settings → Devices & services → Tankstellen Austria, then ⋮ → Download diagnostics. Coordinates and the tracker are redacted.
-
Debug logging:
# configuration.yaml
logger:
  default: info
  logs:
    custom_components.tankstellen_austria: debug
- Go to Settings → Devices & services → Tankstellen Austria and, on each entry, select ⋮ → Delete. Deleting the last entry also removes the card's dashboard resource.
- In Settings → Marketplace, open Tankstellen Austria, then ⋮ → Uninstall. If an entry is still set up, the Marketplace offers Delete and uninstall, and a repair asks you to restart.
- For a manual install, delete
config/custom_components/tankstellen_austria/and restart instead.
Recorded long-term statistics stay until you delete them in Developer tools → Statistics. On a YAML dashboard, remove the card resource yourself.
Every sensor, every diagnostics download and the card footer carry this line, the ATTRIBUTION constant in const.py:
Datenquelle: E-Control
In full: Energie-Control Austria für die Regulierung der Elektrizitäts-, Gas- und Wasserstoffwirtschaft (E-Control). The prices come from the Spritpreisrechner through its public API (API documentation). E-Control publishes no separate terms of use for this API. If you build your own card or dashboard on the data, keep the line visible.
Icon: Font Awesome Free, CC BY 4.0.
MIT, see LICENSE.
Development setup and the verification gate are in CONTRIBUTING.md.
This integration is not affiliated with or endorsed by E-Control. Fuel prices come from E-Control's Spritpreisrechner. The price shown at the pump is the one that counts. The developer assumes no liability for the accuracy, completeness or timeliness of the displayed data. Use at your own risk.
Diese Integration steht in keiner Verbindung zur E-Control und wird von ihr nicht unterstützt. Die Spritpreise stammen vom Spritpreisrechner der E-Control. Es gilt immer der Preis an der Zapfsäule. Für die Richtigkeit, Vollständigkeit und Aktualität der angezeigten Daten wird keine Haftung übernommen. Nutzung auf eigene Verantwortung.