![]()
Performance Co-Pilot (PCP) provides a framework and services to support system-level performance monitoring and management. It presents a unifying abstraction for all of the performance data in a system, and many tools for interrogating, retrieving and processing that data.
- analysis of historical PCP metrics using pmseries query language
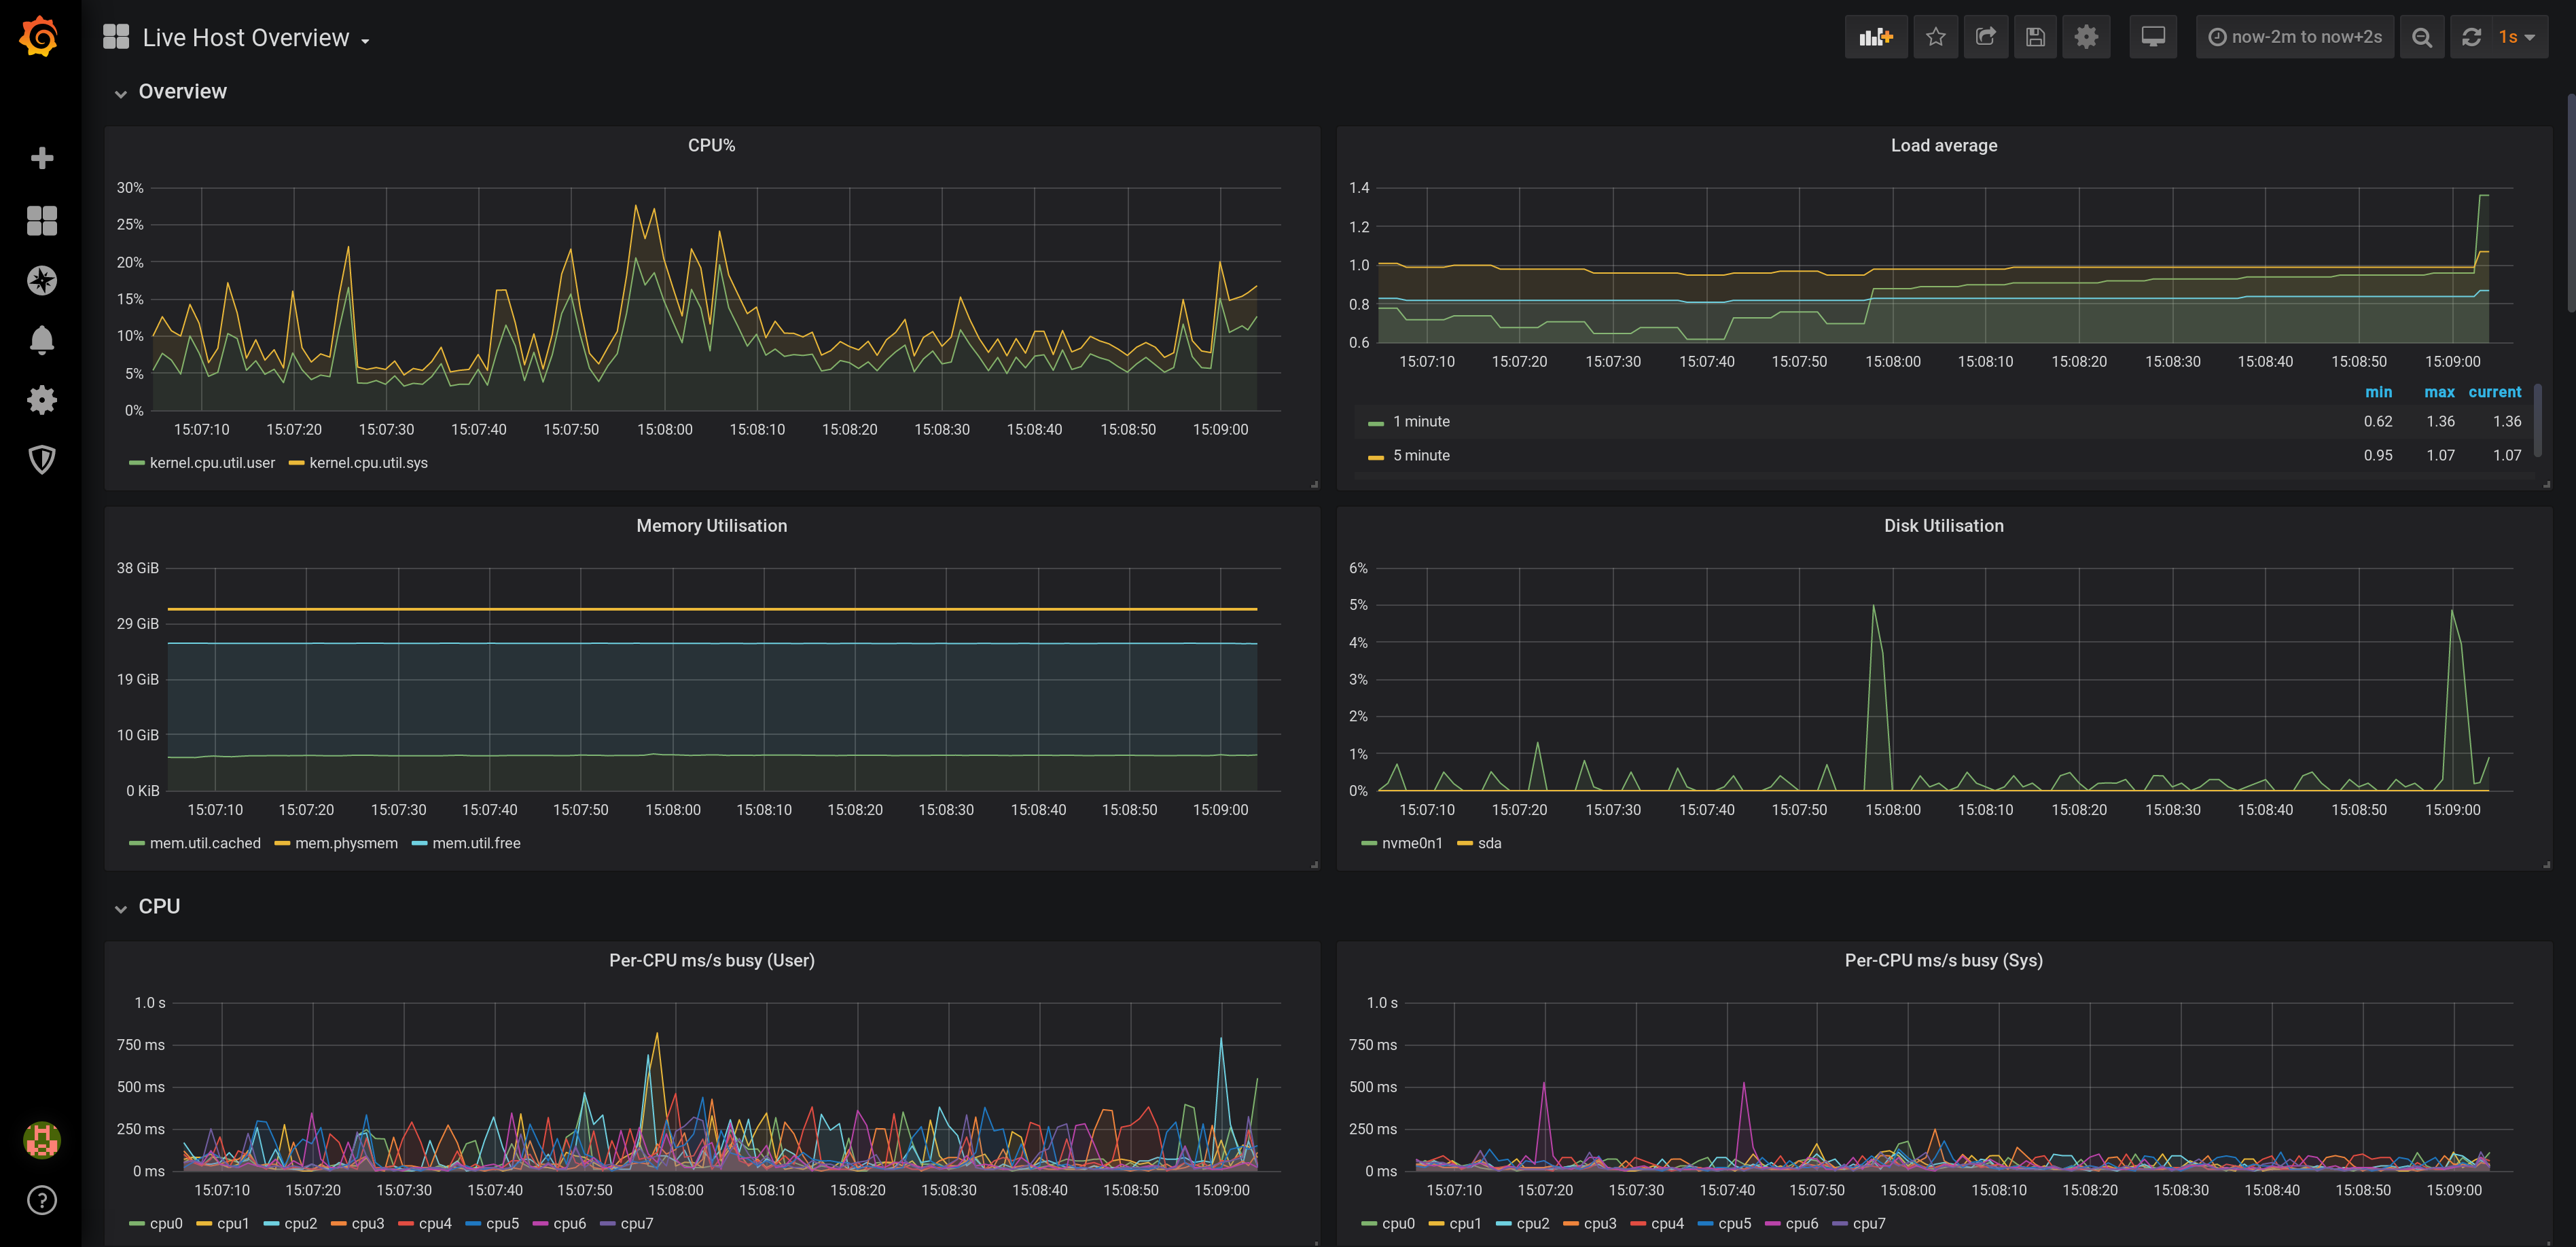
- analysis of real-time PCP metrics using pmwebapi live services
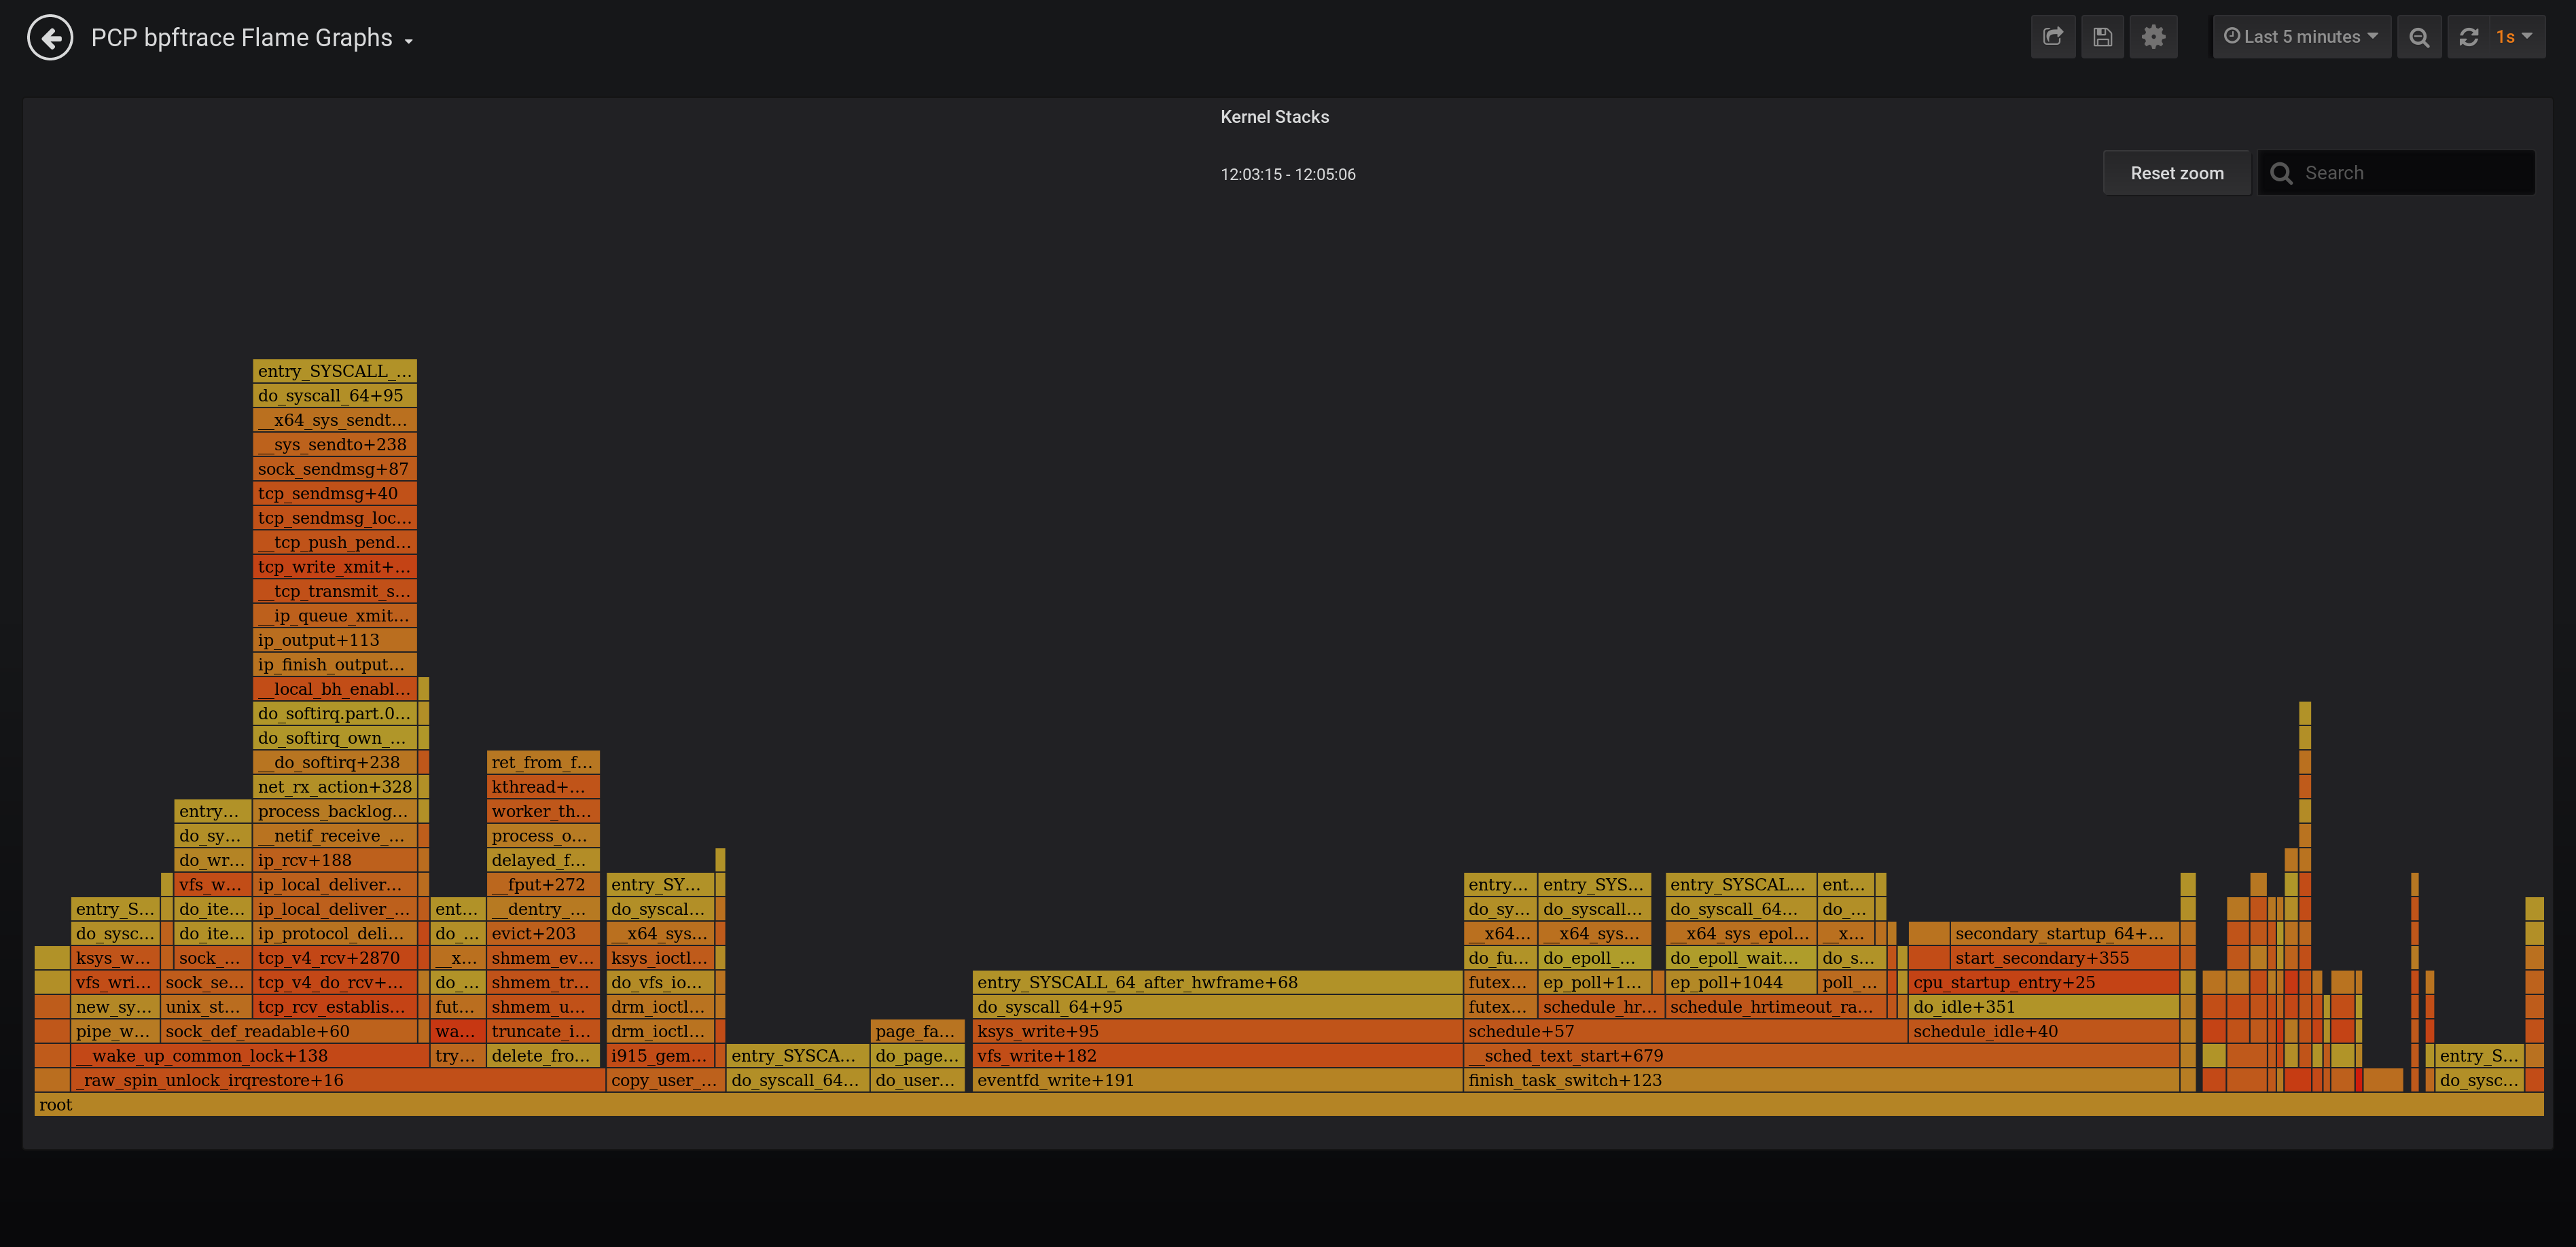
- enhanced Berkeley Packet Filter (eBPF) tracing using bpftrace scripts
- dashboards for detecting potential performance issues and showing possible solutions using the Utilization Saturation and Errors (USE) method [2]
- full-text search in metric names, descriptions, instances [1]
- support for Grafana Alerting [1]
- support for derived metrics (allows the usage of arithmetic operators and statistical functions inside a query) [2]
- automated configuration of metric units [1,2,3]
- automatic rate and time utilization conversion
- heatmap, table [2,3] and flame graph [3] support
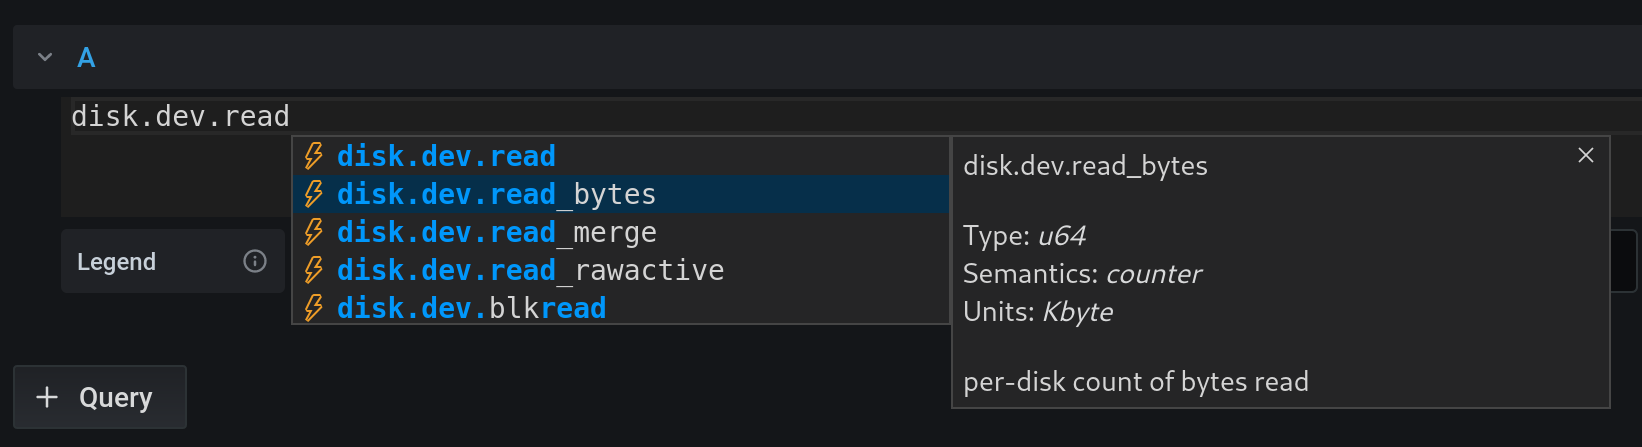
- auto completion of metric names [1,2], qualifier keys and values [1], and bpftrace probes, builtin variables and functions [3]
- display of semantics, units and help texts of metrics [2] and bpftrace builtins [3]
- legend templating support with
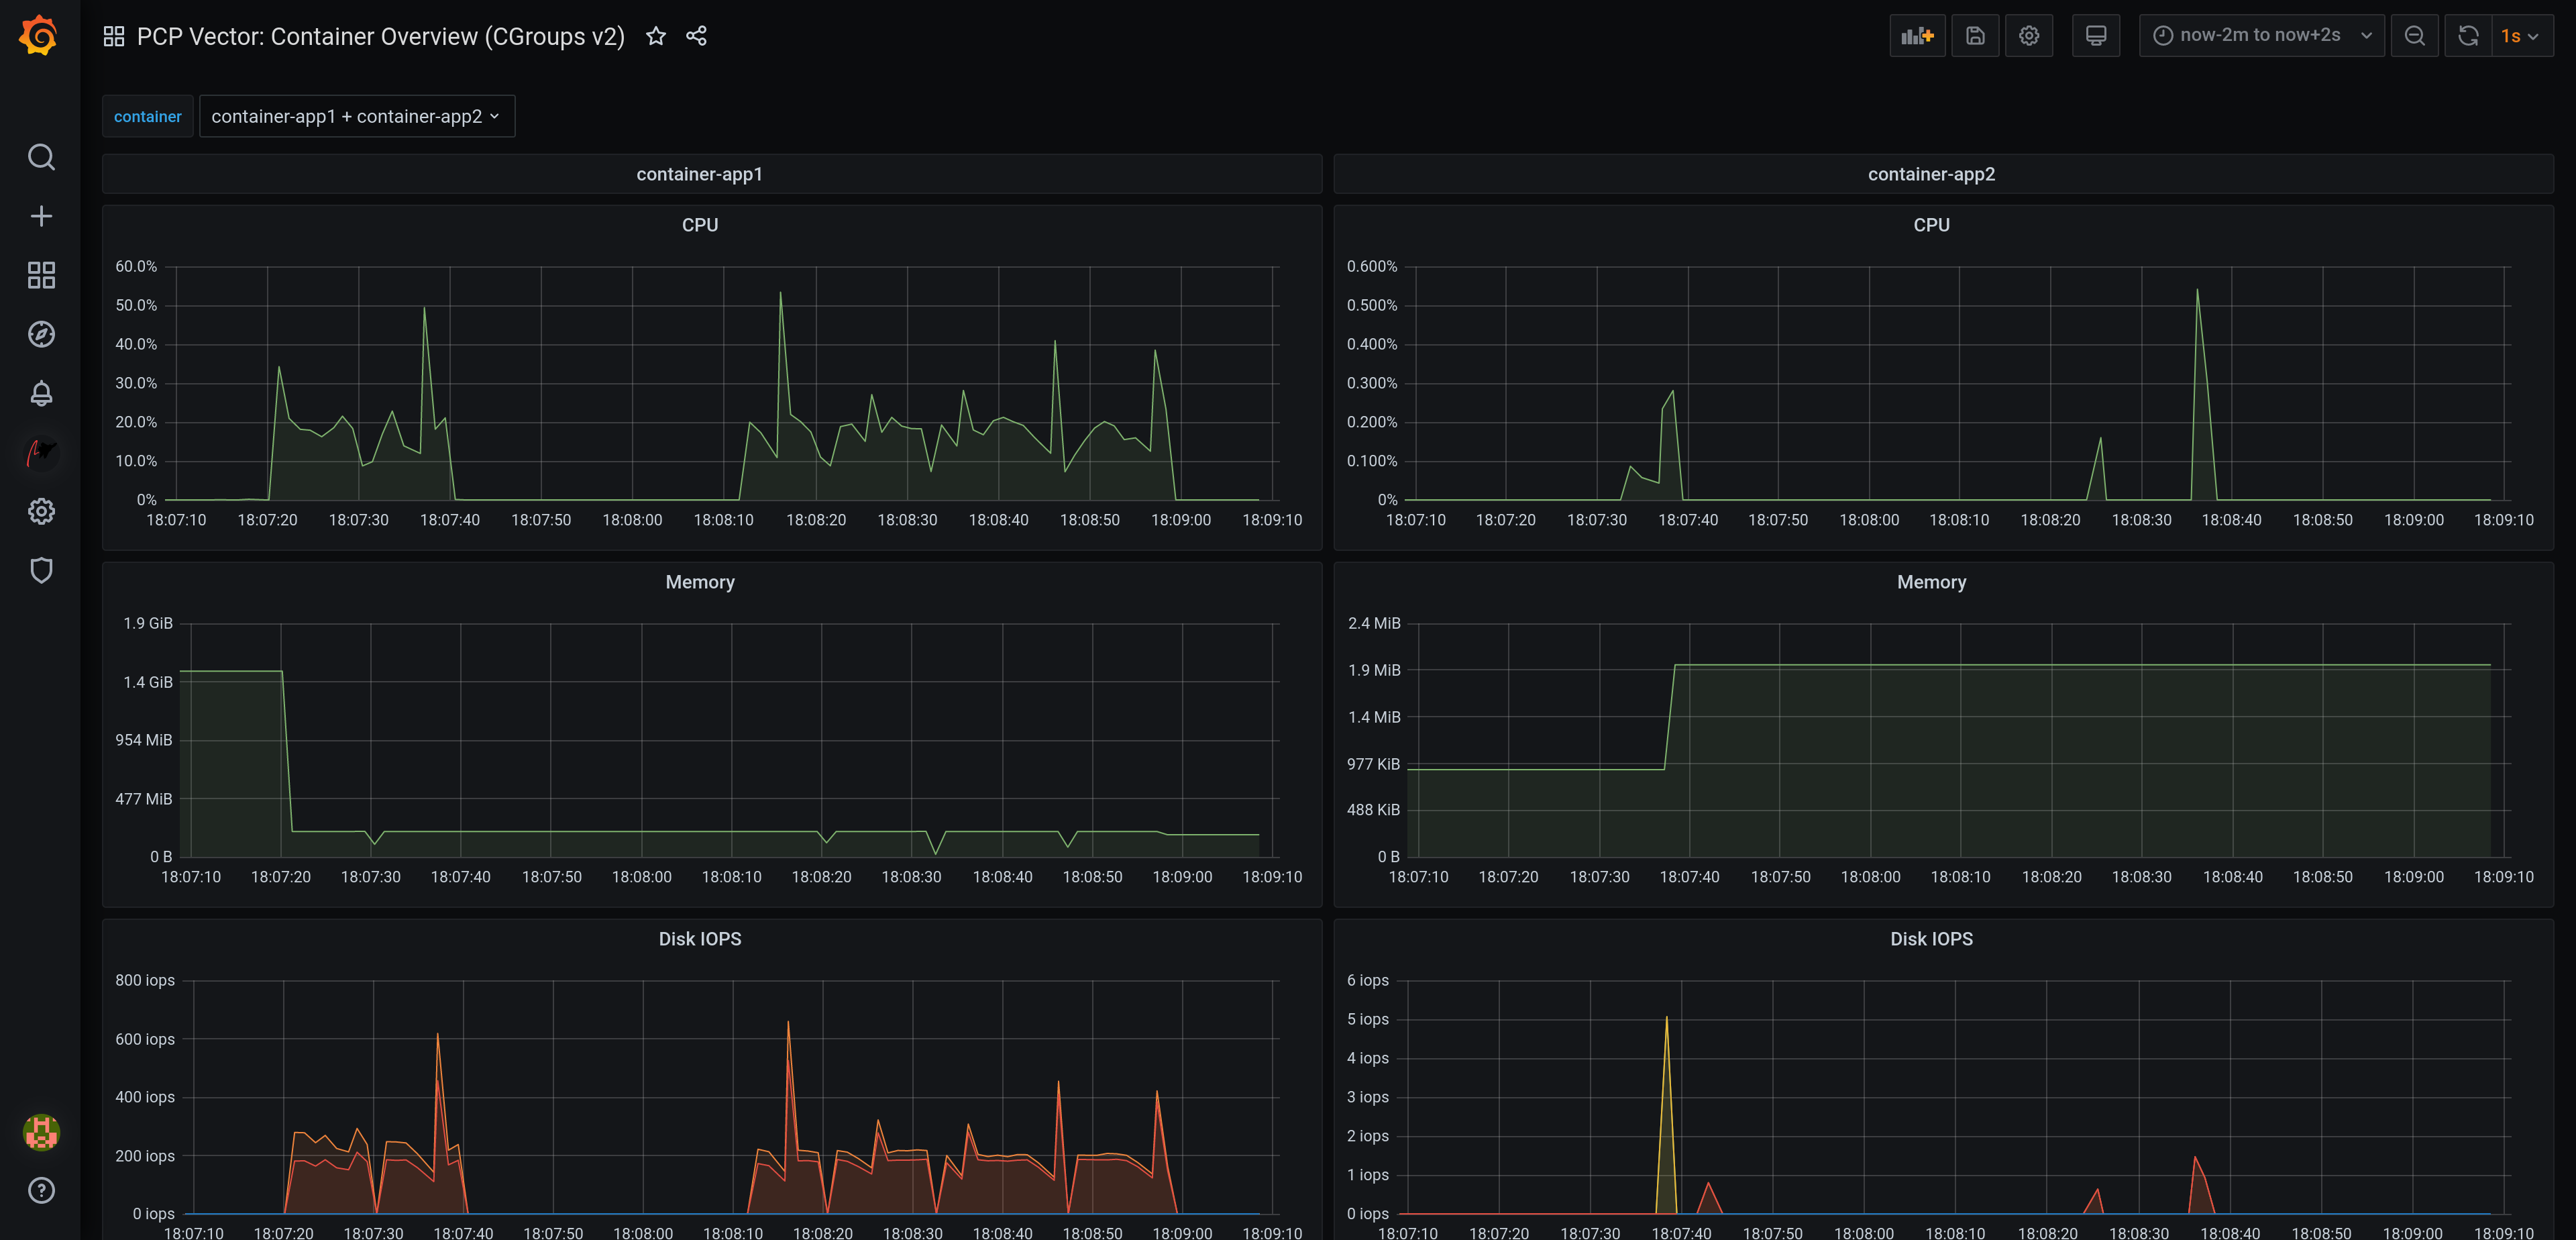
$metric,$metric0,$instance,$some_label,$some_dashboard_variable - container support [1,2]
- support for custom endpoint and hostspec per panel [2,3]
- support for repeated panels
- sample dashboards for all data sources
[1] PCP Redis [2] PCP Vector [3] PCP bpftrace