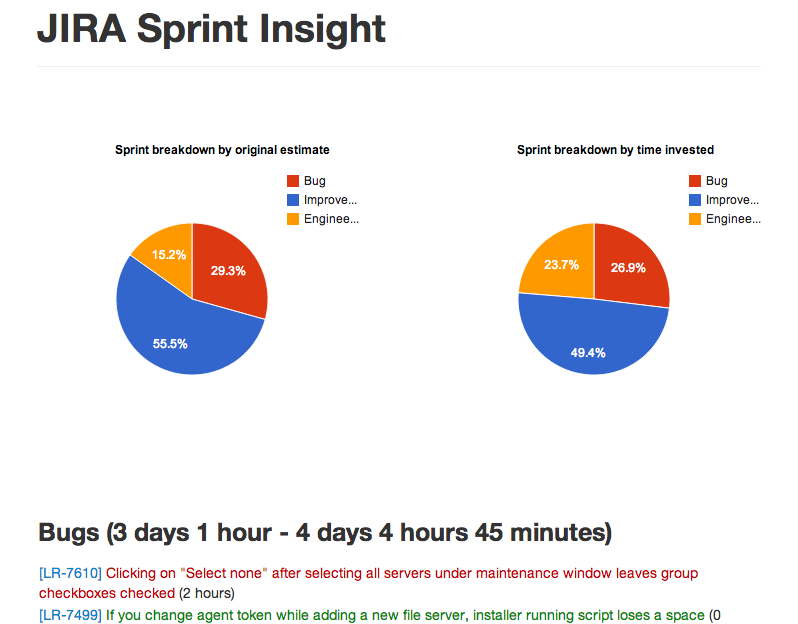
Although JIRA has tons of options to add charts based on your favourite queries and filters it is kind of difficult (or impossible) to generate certain charts. For example I've been especially interested in the split of how much time was spent on bugs, improvements or engineering tasks.
Also quickly highlighting issues that we've haven't estimated too well is a big plus when you go over the sprints stats after the sprint.
There is a live demo available at http://toomasr.com/sprint-analysis/ . To use is you need to export your issues from your JIRA filter to XML format and then drag and drop it to the webpage.
Check this repository out to a folder on a server that has PHP installed. Create a subfolder uploads and make sure that the web server has the rights to write files into that folder. The tool will store the XML files there and also log some debug log. I've added a htaccess rule to make sure the log file is not readable over HTTP.
