- Weewx Weather Data Center skin
Inspired by and build with the Carbon Design System. This skin uses the same technologies as Weather Data Center, a cross-platform Desktop App to import and analyze weather data, I wrote.
If you need help installing the skin, please have a look at https://github.com/Daveiano/weewx-interceptor-docker, a configured Dockerfile which I use as a base for my local PI installation.
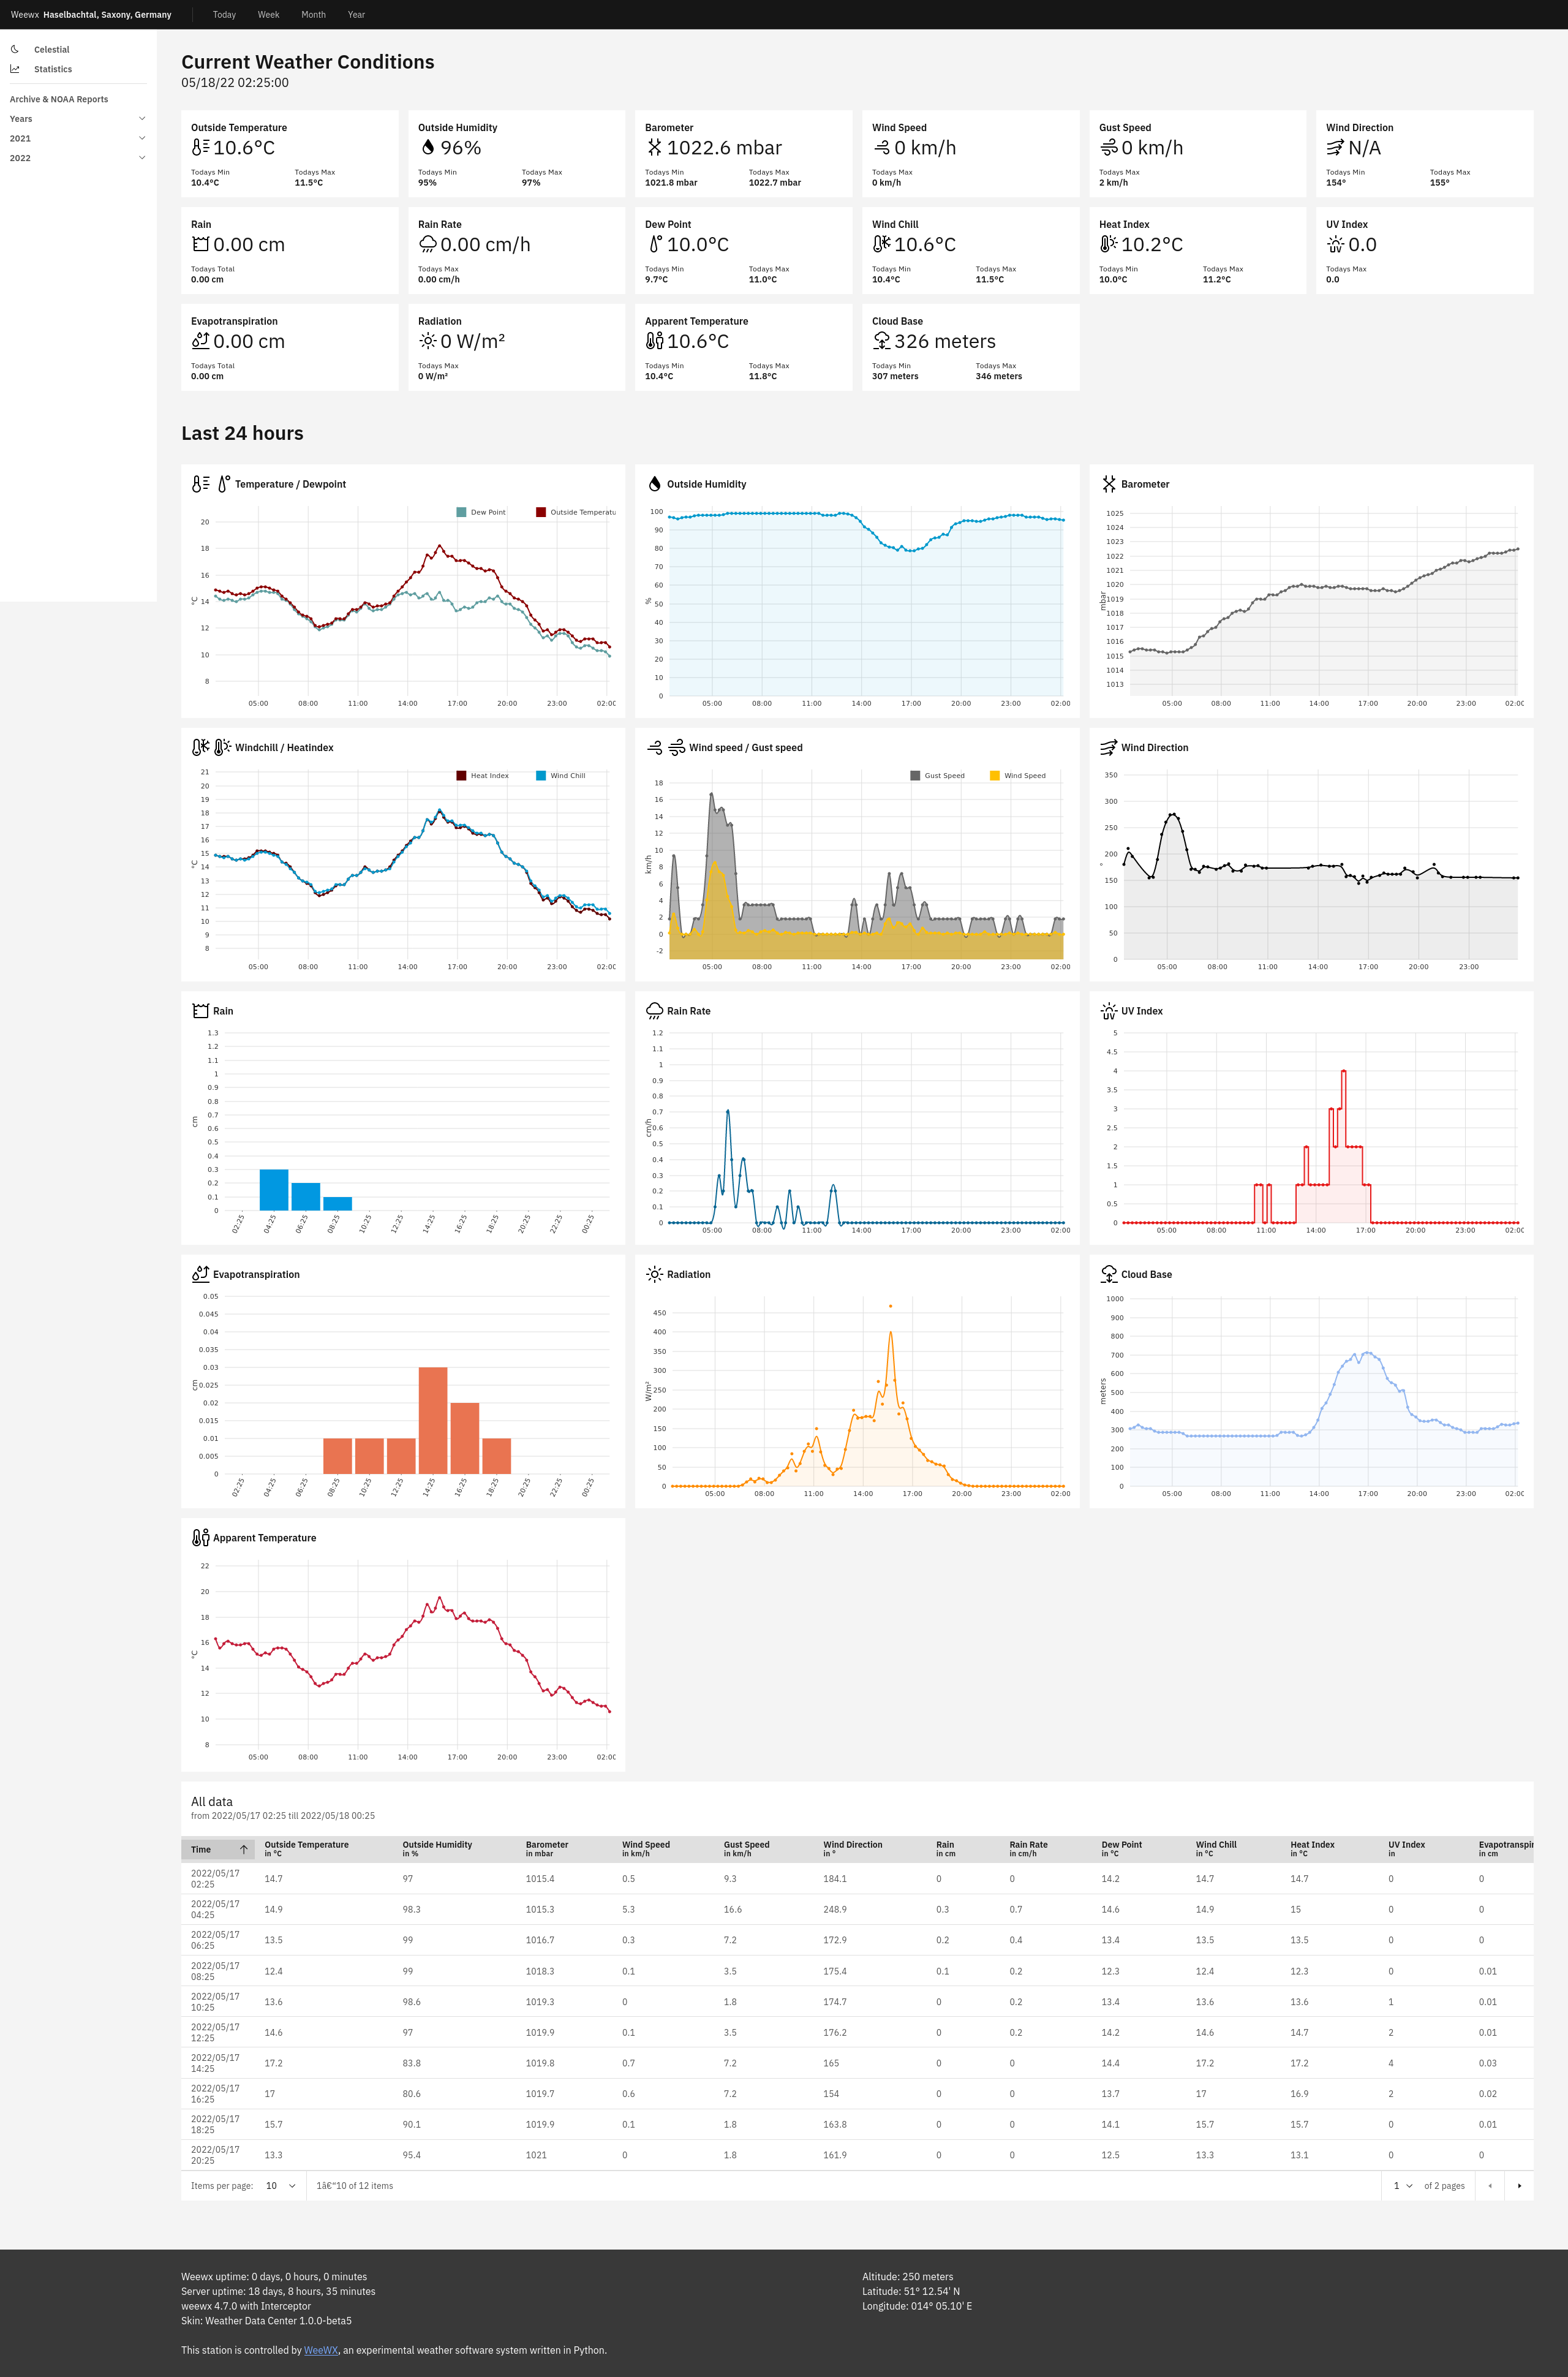
- Clear and beautiful UI thanks to IBM Carbon and nivo
- Configurable Statistic Tiles and Diagram tiles
- Combinable diagrams via skin.conf
- Responsive
- Day, week, month, year and all-time pages
- Archive and NOAA Reports
- Almanac
- Translated for DE and EN
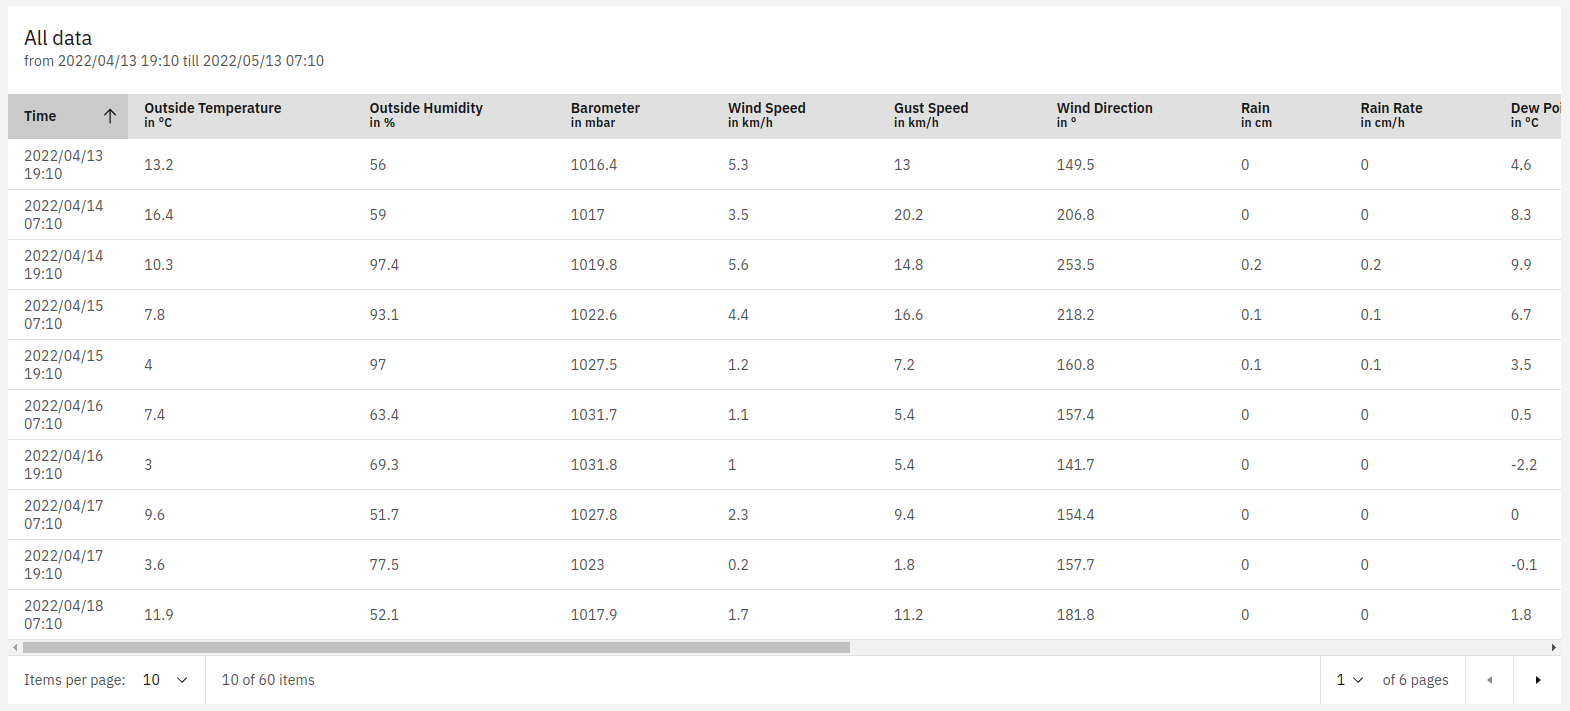
- Tabular representation with Carbon Data Tables
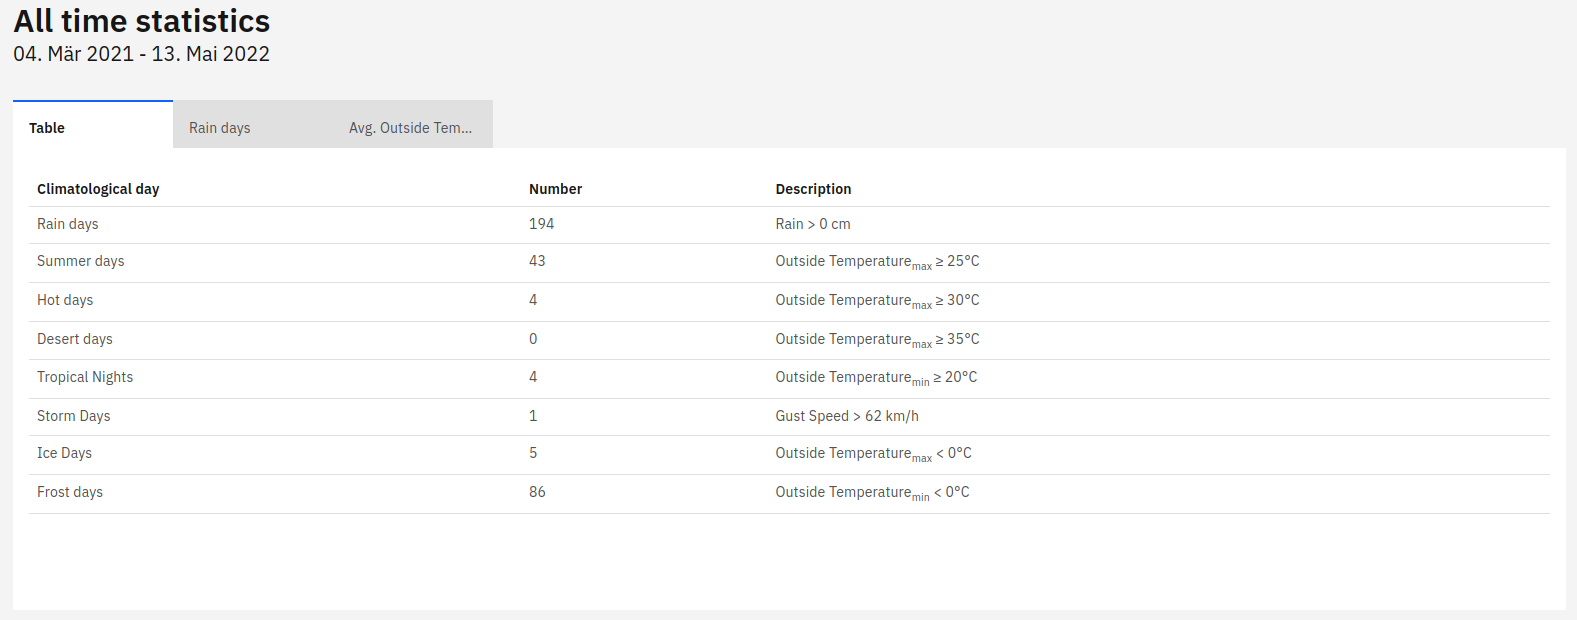
- Climatological days
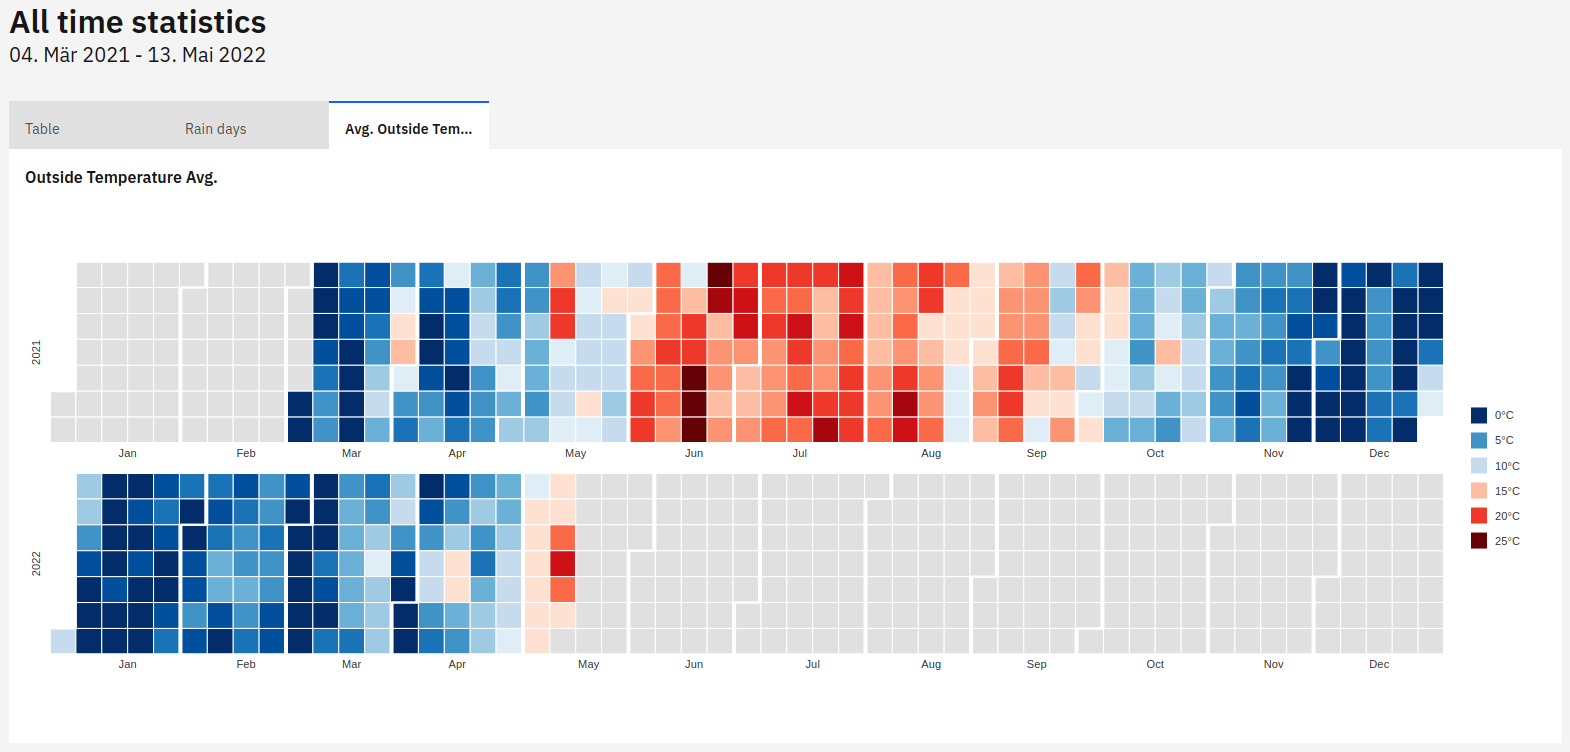
- Calendar charts for rain days and average day temperature
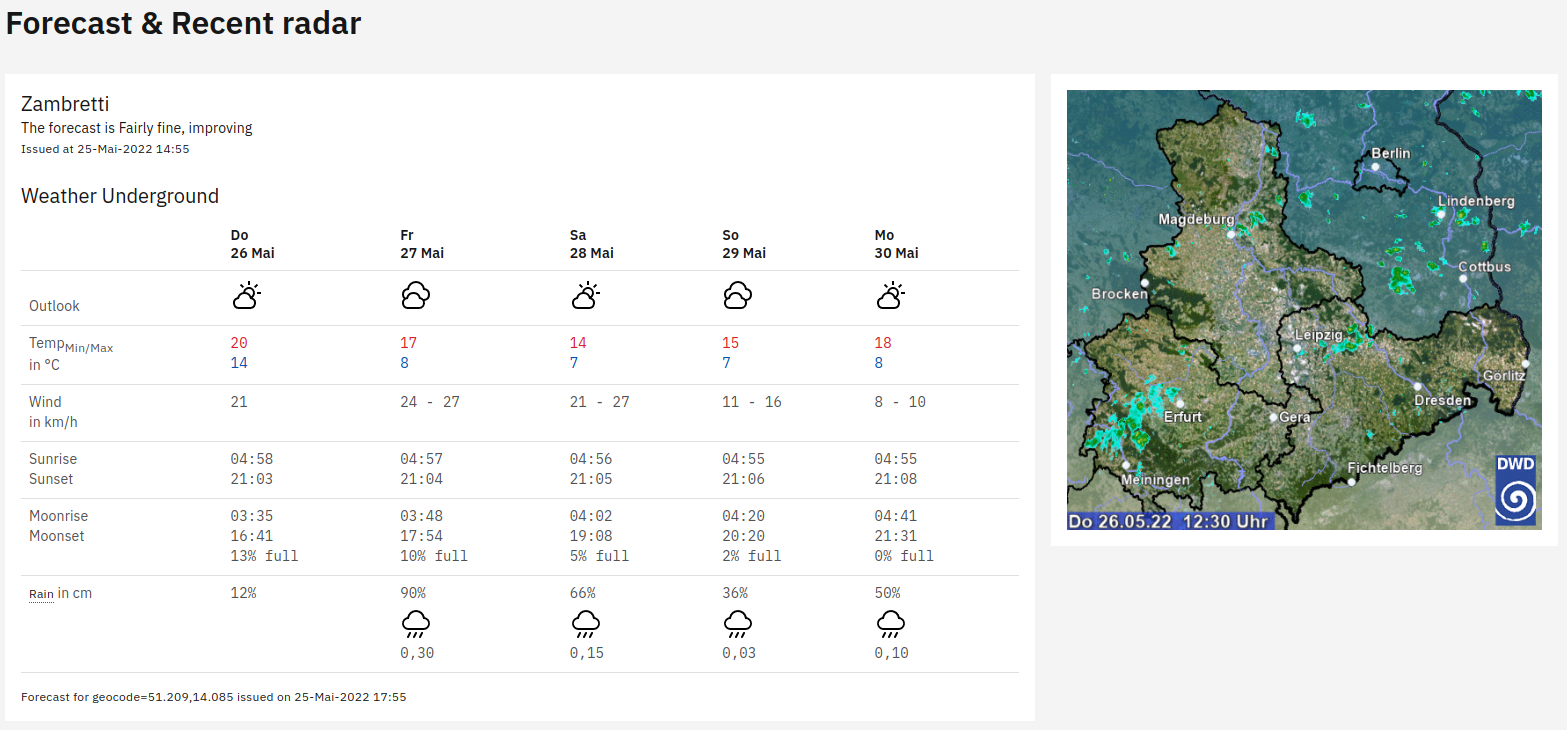
- Support for weewx-forecast
- Download the latest version
- Create a new folder and unzip to that folder
- Install the extension: wee_extension --install=path/to/weewx-wdc
- Restart weewx: weewx restart
For help, please have a look at the official weewx documentation.
The default skin.conf looks like this:
# configuration file for the weewx-wdc skin
SKIN_NAME = Weather Data Center
SKIN_VERSION = 1.0.0-beta2

[Extras]
    # Show a link to the GitHub respository of this skin. Set to False to hide.
    github_link = True

    # This radar image would be available as $Extras.radar_img
    radar_img = https://www.dwd.de/DWD/wetter/radar/radfilm_sac_akt.gif
    # This URL will be used as the image hyperlink:
    radar_url =	https://www.dwd.de/DE/leistungen/radarbild_film/radarbild_film.html

    [[forecast_table_settings]]
        source = WU
        num_periods = 72
        num_days = 5
        show_legend = 1
        show_hourly = 1
        show_day = 1
        show_date = 1
        show_outlook = 1
        show_temp = 1
        show_dewpoint = 0
        show_humidity = 0
        show_wind = 1
        show_tides = 0
        show_sun = 1
        show_moon = 1
        show_pop = 1
        show_precip = 1
        show_obvis = 0

[DisplayOptions]
    climatological_days = rainDays, summerDays, hotDays, desertDays, tropicalNights, stormDays, iceDays, frostDays
    table_tile_observations = outTemp, outHumidity, barometer, windSpeed, windGust, windDir, rain, rainRate, snowDepth, dewpoint, windchill, heatindex, UV, ET, radiation, appTemp, cloudbase, extraTemp1, extraHumid1, extraTemp2, extraHumid2, extraTemp3, extraHumid3, extraTemp4, extraHumid4, extraTemp5, extraHumid5, extraTemp6, extraHumid6, extraTemp7, extraHumid7, extraTemp8, extraHumid8
    stat_tile_observations = outTemp, outHumidity, barometer, windSpeed, windGust, windDir, rain, rainRate, snowDepth, dewpoint, windchill, heatindex, UV, ET, radiation, appTemp, cloudbase, extraTemp1, extraHumid1, extraTemp2, extraHumid2, extraTemp3, extraHumid3, extraTemp4, extraHumid4, extraTemp5, extraHumid5, extraTemp6, extraHumid6, extraTemp7, extraHumid7, extraTemp8, extraHumid8
    diagram_tile_observations = tempdew, outHumidity, barometer, windchill_heatindex, wind, windDir, rain, rainRate, snowDepth, UV, ET, radiation, cloudbase, appTemp
    [[diagram_tile_combined_obervations]]
        [[[tempdew]]]
            label = 'Temperature / Dewpoint'
            [[[[obs]]]]
                [[[[[outTemp]]]]]
                [[[[[dewpoint]]]]]

        [[[windchill_heatindex]]]
            label = 'Windchill / Heatindex'
            [[[[obs]]]]
                [[[[[windchill]]]]]
                    color = '#0099CC'
                [[[[[heatindex]]]]]
                    color = '#610000'

        [[[wind]]]
            label = 'Wind speed / Gust speed'
            [[[[obs]]]]
                [[[[[windSpeed]]]]]
                [[[[[windGust]]]]]

[CheetahGenerator]
    encoding = html_entities
    search_list_extensions = user.general_util.GeneralUtil, user.stats_util.StatsUtil, user.diagram_util.DiagramUtil, user.celestial_util.CelestialUtil, user.archive_util.ArchiveUtil, user.table_util.TableUtil

    [[SummaryByMonth]]
        # Reports that summarize "by month"
        [[[NOAA_month]]]
            encoding = normalized_ascii
            template = NOAA/NOAA-%Y-%m.txt.tmpl
        [[[summary_month]]]
            template = month-%Y-%m.html.tmpl

    [[SummaryByYear]]
        # Reports that summarize "by year"
        [[[NOAA_year]]]
            encoding = normalized_ascii
            template = NOAA/NOAA-%Y.txt.tmpl
        [[[summary_year]]]
            template = year-%Y.html.tmpl

    # Reports that show statistics "to date", such as day-to-date,
    # week-to-date, month-to-date, etc.
    [[ToDate]]
        [[[day]]]
            template = index.html.tmpl

        [[[week]]]
            template = week.html.tmpl

        [[[month]]]
            template = month.html.tmpl

        [[[year]]]
            template = year.html.tmpl

        [[[statistics]]]
            template = statistics.html.tmpl

        [[[celestial]]]
            template = celestial.html.tmpl

[CopyGenerator]
    copy_once = dist/js/index.js, dist/scss/index.css, favicon.ico
    # copy_always =

[Generators]
    generator_list = weewx.cheetahgenerator.CheetahGenerator, weewx.reportengine.CopyGenerator
github_link Set to False to disable.
radar_img and radar_url Same as in the default Seasons Skin
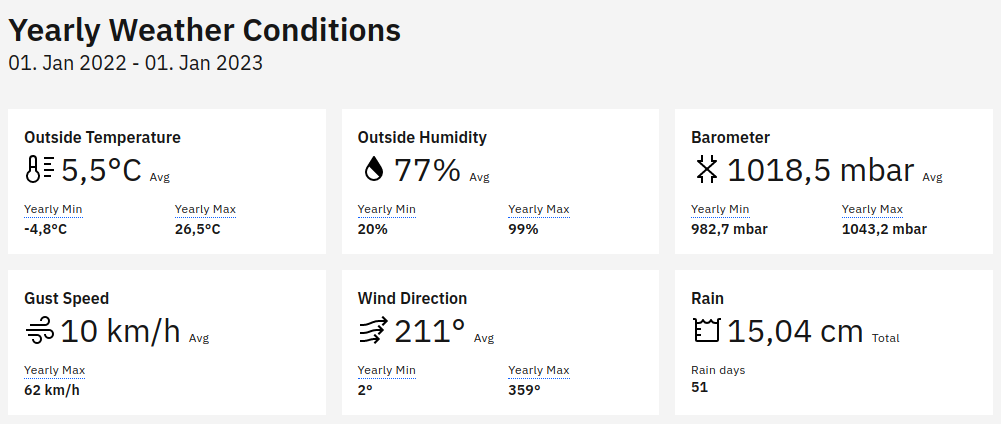
climatological_days E.g. Rain days (days with precipitation) or Summer days (Temp > 25°C). Leave empty to disable. When activated a rain days calendar chart and an averge temperature calendar chart is shown alongside.
table_tile_observations Defines which observations should be shown in the data table component.
stat_tile_observations Define which observations should be shown in the stat tiles (at the top of each page).
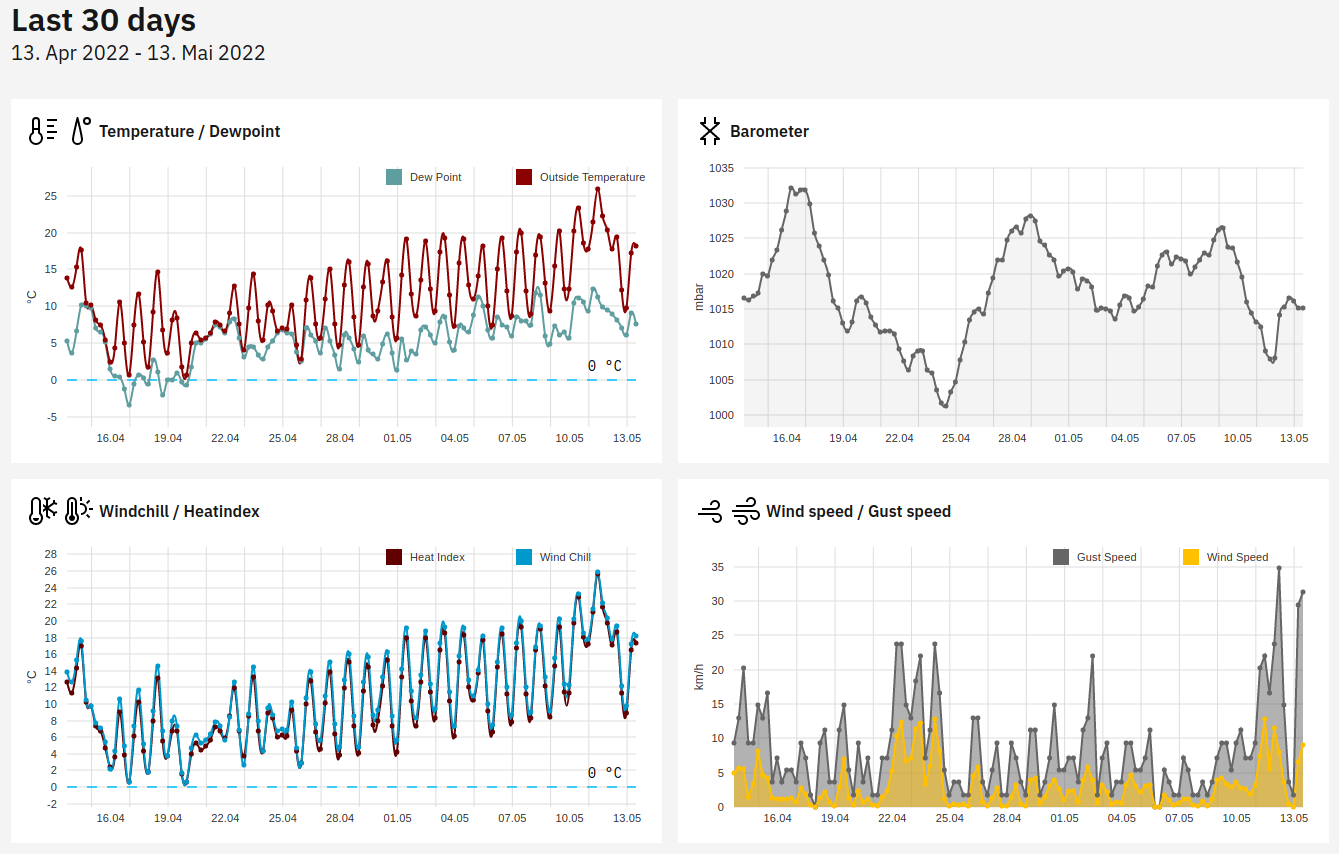
diagram_tile_observations Define which observations to show as diagrams. This can include definitions for combined diagrams. Combined diagrams (like Temperature and Dew point or Windchill and Heat index) need to be defined in the [[diagram_tile_combined_obervations]] section like this:
For a combined diagram of Temperature and Dew point:
[[[tempdew]]]                           # 1
    label = 'Temperature / Dewpoint'    # 2
    [[[[obs]]]]                         # 3
        [[[[[outTemp]]]]]
        [[[[[dewpoint]]]]]
            color = '#610000'           # 4
# 1 Name of the combined diagram, needs to be the same as used in diagram_tile_observations.
# 2 Label of the diagram.
# 3 Under the key obs specify the observations to combine.
# 4 Optionally define a color.
Add user.forecast.ForecastVariables to [CheetahGenerator].search_list_extensions in weewx-wdc skin.conf.
It should look like this
...
[CheetahGenerator]
    encoding = html_entities
    search_list_extensions = user.general_util.GeneralUtil, user.stats_util.StatsUtil, user.diagram_util.DiagramUtil, user.celestial_util.CelestialUtil, user.archive_util.ArchiveUtil, user.table_util.TableUtil, user.forecast.ForecastVariables
...
weewx-wdc includes predefined and tested configuration values for the forecast table template, located in skin.conf in forecast_table_settings.
Please set source to your used forecast source. For help on configuring weewx-forecast, see https://github.com/chaunceygardiner/weewx-forecast.
The skin currently has an english and a german translation, you can change the language in weewx.conf:
[[WdcReport]]
    skin = weewx-wdc
    enable = true
    lang = de
The skin uses the Cheetah templating engine provided by weewx in combination with carbon web components and a react entry point to render the diagrams written in TypeScript via nivo. Bundling for Typescript and SCSS is done via parcel.
Starts parcel in watch mode
Builds the assets
Only works if weewx is installed via package, see https://weewx.com/docs/setup.htm. Copies all skin files in the corresponding weewx installation folders, restarts weewx and triggers a new generation of files via wee_reports:
sudo cp -R ./skins/weewx-wdc /etc/weewx/skins && sudo cp -r ./bin/user/. /usr/share/weewx/user/ && sudo systemctl restart weewx && sudo /usr/share/weewx/wee_reports
Only works if weewx is installed via package, see https://weewx.com/docs/setup.htm. Starts a nginx docker container to serve the generated files.
docker run -it --rm -d -p 8080:80 --name web -v /var/www/html/weewx:/usr/share/nginx/html nginx
- Add Climatological stat tiles (for the archive?) for eg. Rain Days, Hot days, Tropical Nights, etc.
- Add Temperature, Rain pages like in WDC
This skin uses only free software. You can read more about Carbon IBM (licensed under the Apache-2.0 license) here: https://carbondesignsystem.com/contributing/overview/#introduction. nivo is licensed under the MIT license.
Thanks to ngulden for the niculskin and neoground for the neowx-material skin. Both are amazing skins and gave me a basic understanding of creating a weewx skin.
The config, NOAA Reports and some templating ideas and concepts are based on the orignal Standard and Seasons weewx skins by Tom Keffer and the weewx contributors.