- Description
- Installation
- Example plots
- Resources
- Getting help
- Contributors
- Citation information
- License
VennDiagram is a R package for generating high-resolution, customizable Venn diagrams with up to four sets and Euler diagrams with up to three sets. Includes handling for several special cases including two-case scaling, and extensive customization of plot shape and structure.
To install the latest public release of VennDiagram from CRAN:
install.packages('VennDiagram');Or to install the latest development version from Github:
# If `devtools` is not already installed, run:
# install.packages("devtools");

devtools::install_github('uclahs-cds/public-R-VennDiagram');How to make a simple Venn diagram:
library(VennDiagram);
vd <- VennDiagram::venn.diagram(list(A = 1:150, B = 121:170), filename = NULL);
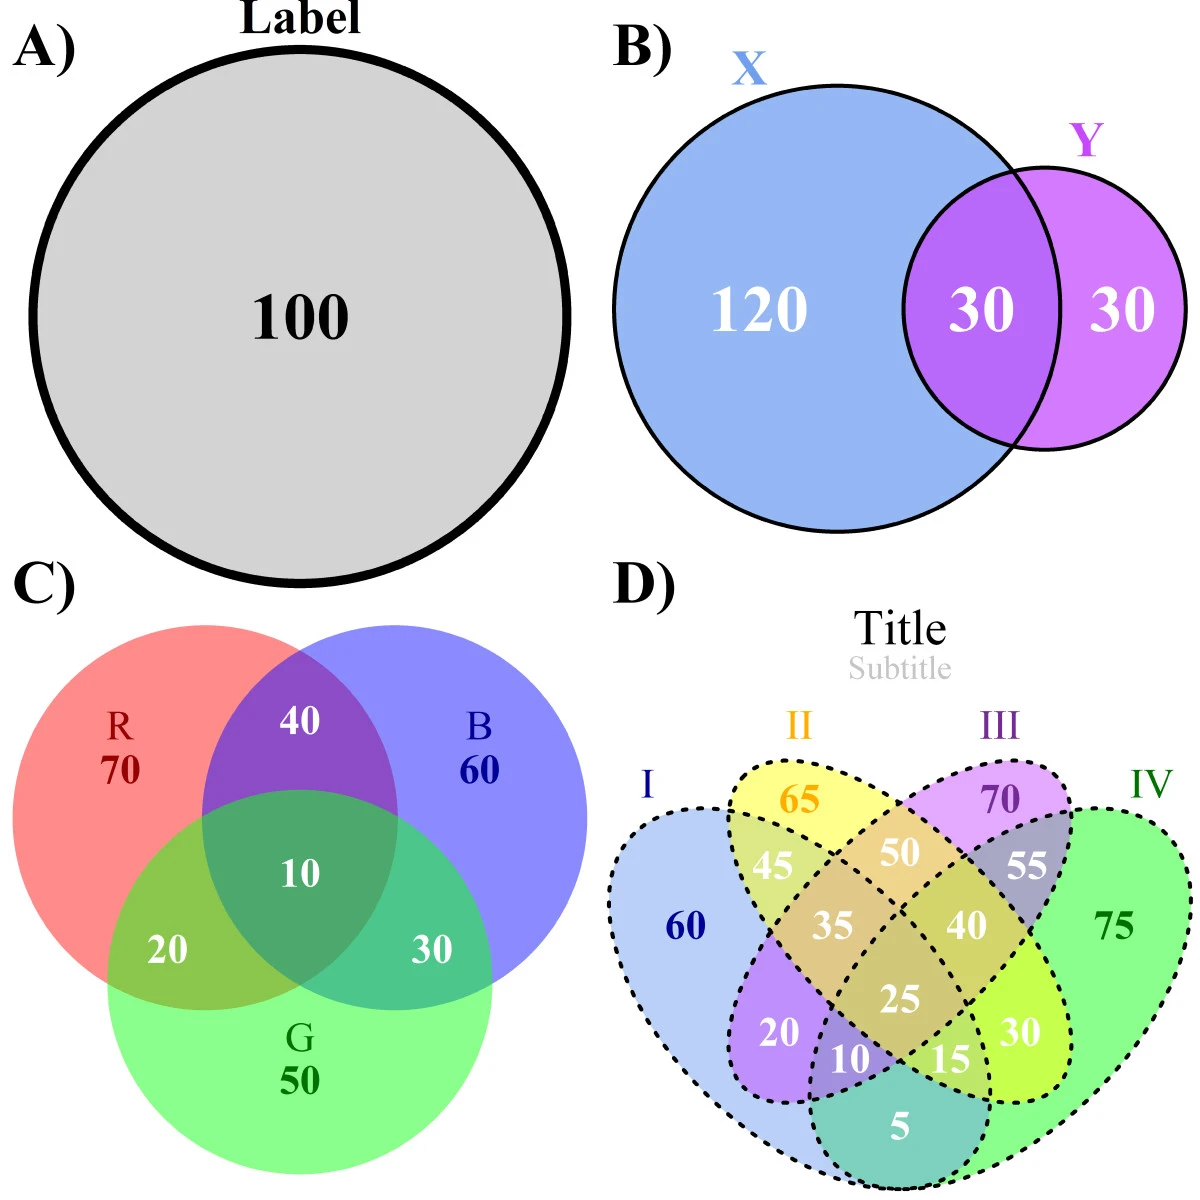
grid::grid.draw(vd);The four types of Venn diagrams drawn by the VennDiagram package:
- A one-set Venn diagram showing rudimentary customizable features such as label font size, label font face, and shape-fill.
- A two-set Venn diagram showing more advanced features such as scaling, individual shape-fill specifications, and individual caption label placement.
- A three-set Venn diagram showing a different shape-line type ("transparent") and the "text" option of caption label placement where the caption labels are attached to area labels.
- A four-set Venn diagram showing a combination of all previous features plus the ability to customize titles.
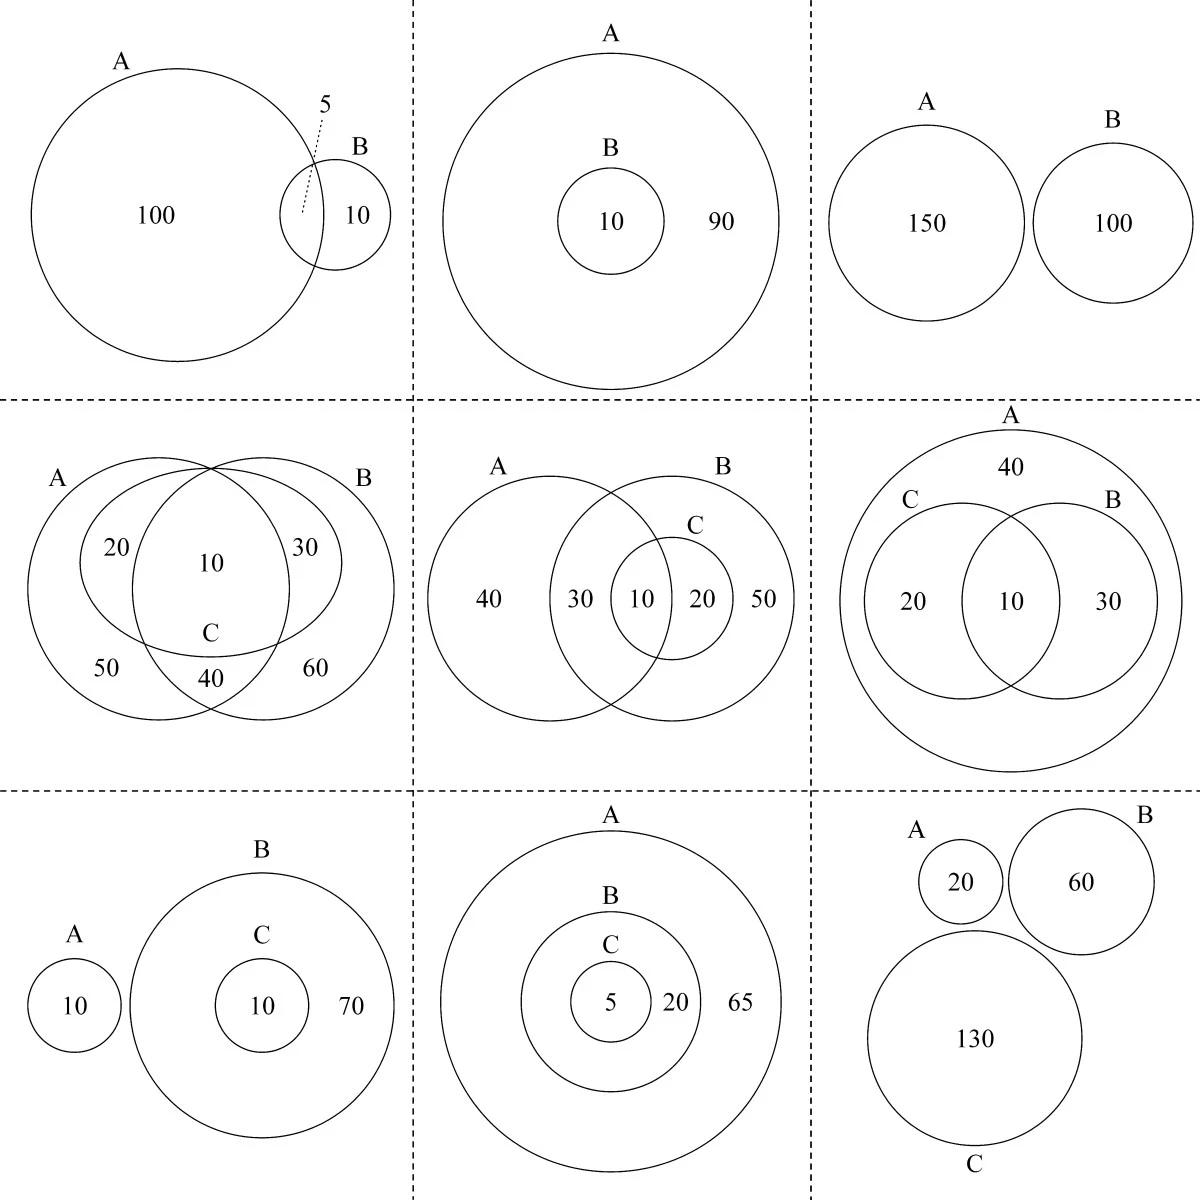
Selected Venn diagram special cases and Euler diagrams drawn by the VennDiagram package.
- Row 1, column 1: automatically drawn, customizable lines that optimize display of partial areas when individual partial areas become too small in two-set Venn diagrams.
- Row 1, column 2: a two-set Euler diagram showing total inclusion of one of the sets.
- Row 1, column 3: a two-set Euler diagram showing two distinct sets.
- Row 2, column 1: a three-set Euler diagram where one set has no discrete elements.
- Row 2, column 2: a three-set Euler diagram where one set has no discrete elements is totally included in one of the other two sets.
- Row 2, column 3: a three-set Euler diagram where two sets have no discrete elements and are included in a larger third set.
- Row 3, column 1: a three-set Euler diagram showing total inclusion of two sets that are distinct from the third set.
- Row 3, column 2: a three-set Euler diagram where one set is totally included in another set, which is itself totally included in the third set.
- Row 3, column 2: a three-set Euler diagram showing three distinct sets.
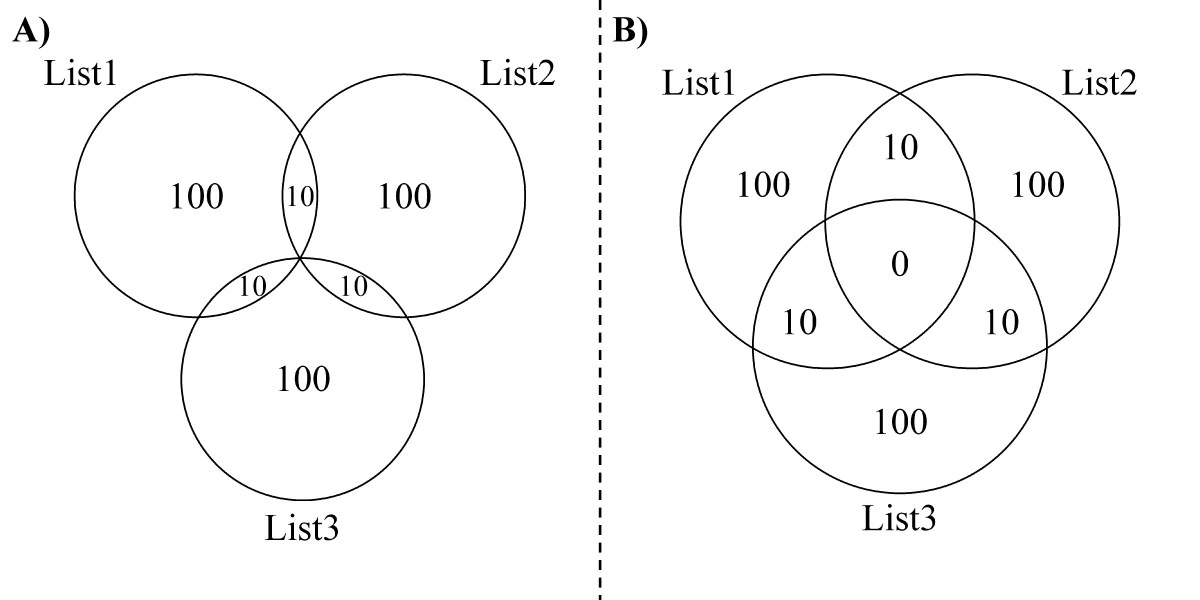
A side-by-side comparison of an Euler diagram and a Venn diagram for the same hypothetical sets.
- The Euler diagram shows only non-zero areas and can therefore be more graphically accurate.
- The Venn diagram shows the non-existent area as an area with zero content. Though this is not graphically accurate, it preserves the recognisability of a Venn diagram.
Available resources for VennDiagram include the package CRAN page and reference manual.
For guidance or support with VennDiagram check out Discussions
See Issues to submit bugs, suggest new features or view current works
Pull requests are also open for discussion.
Contributors to this package can be viewed here on GitHub.
To cite package VennDiagram in publications, use:
Chen, H., Boutros, P.C. VennDiagram: a package for the generation of highly-customizable Venn and Euler diagrams in R. BMC Bioinformatics 12, 35 (2011). https://doi.org/10.1186/1471-2105-12-35
A BibTeX entry for LaTeX users is:
@Article{,
    title = {VennDiagram: a package for the generation of highly-customizable Venn and Euler diagrams in R},
    journal = {BMC Bioinformatics},
    doi = {10.1186/1471-2105-12-35},
    url = {https://doi.org/10.1186/1471-2105-12-35},
    volume = {12},
    number = {35},
    year = {2011},
    month = {January},
    day = {26},
    issn = {1471-2105},
    author = {Hanbo Chen and Paul C Boutros}
  }
This information is available via citation('VennDiagram')
Authors: Hanbo Chen, Dan Knight, Stefan Eng & Paul C. Boutros ([email protected])
VennDiagram is licensed under the GNU General Public License version 2. See the file LICENSE.md for the terms of the GNU GPL license.
VennDiagram is a R package enabling generation and customization of quality Venn diagrams and Euler diagrams.
Copyright (C) 2015-2018 Ontario Institute for Cancer Research and 2018-2023 University of California Los Angeles ("Boutros Lab") All rights reserved.
This program is free software; you can redistribute it and/or modify it under the terms of the GNU General Public License as published by the Free Software Foundation; either version 2 of the License, or (at your option) any later version.
This program is distributed in the hope that it will be useful, but WITHOUT ANY WARRANTY; without even the implied warranty of MERCHANTABILITY or FITNESS FOR A PARTICULAR PURPOSE. See the GNU General Public License for more details.