

See your agent think. Real-time observability for OpenClaw AI agents.
One command. Zero config. Auto-detects everything.
pip install clawmetry && clawmetryOpens at http://localhost:8900 and you're done.
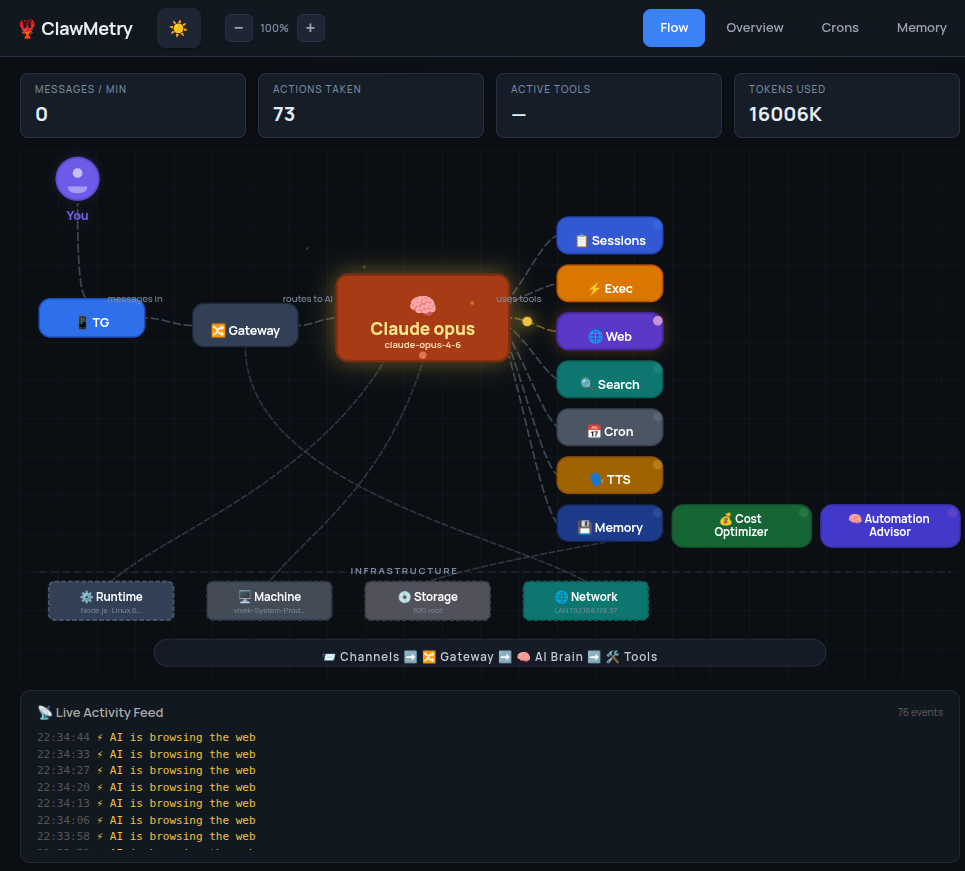
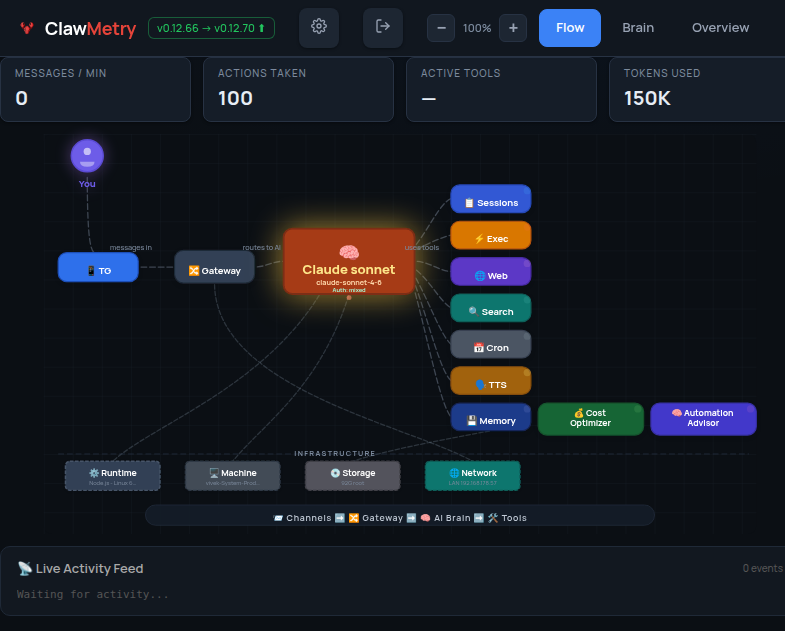
- Flow — Live animated diagram showing messages flowing through channels, brain, tools, and back
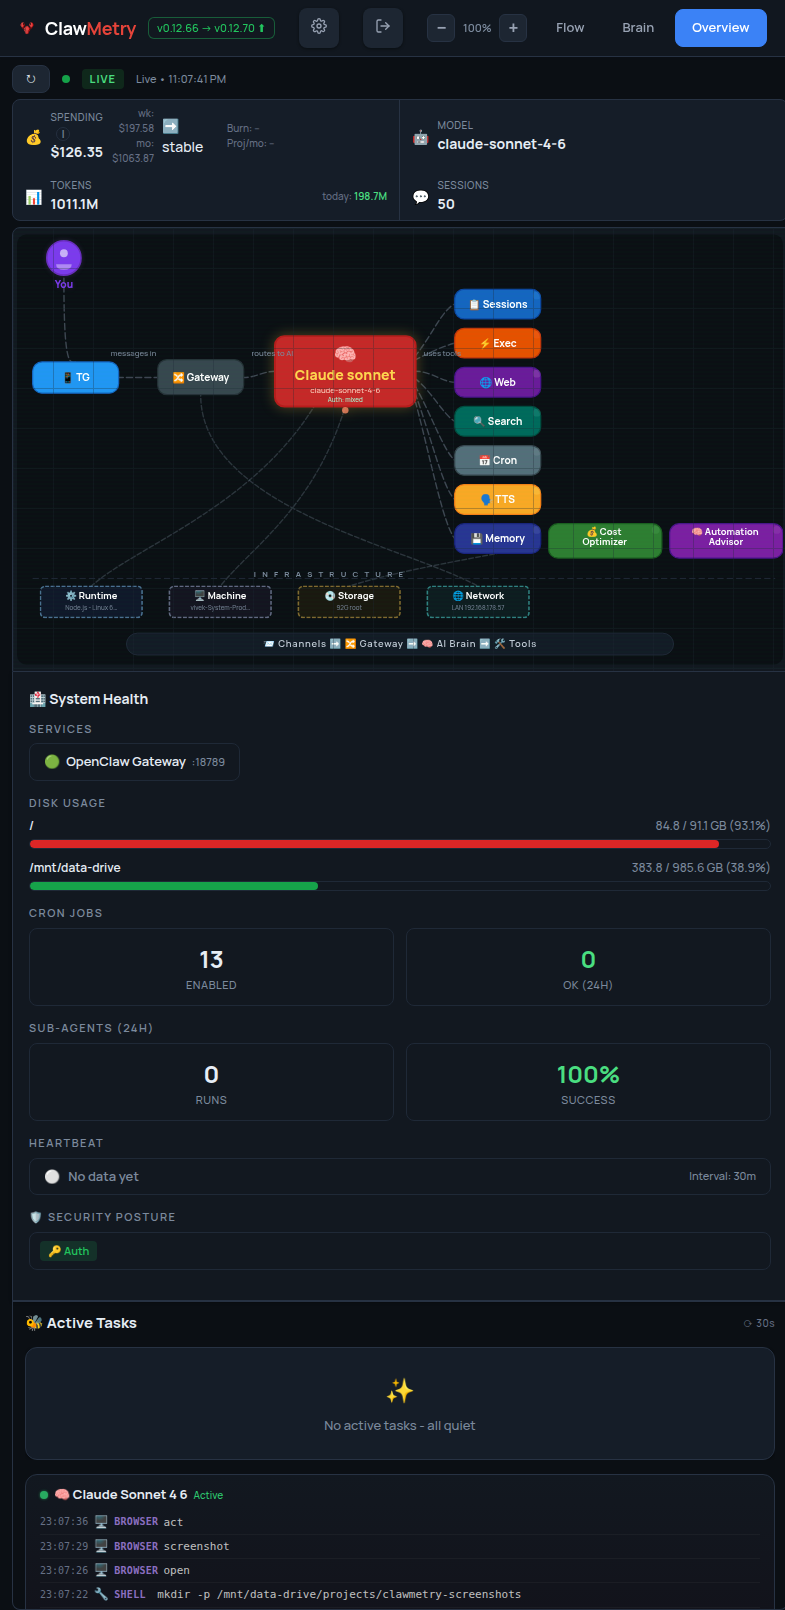
- Overview — Health checks, activity heatmap, session counts, model info
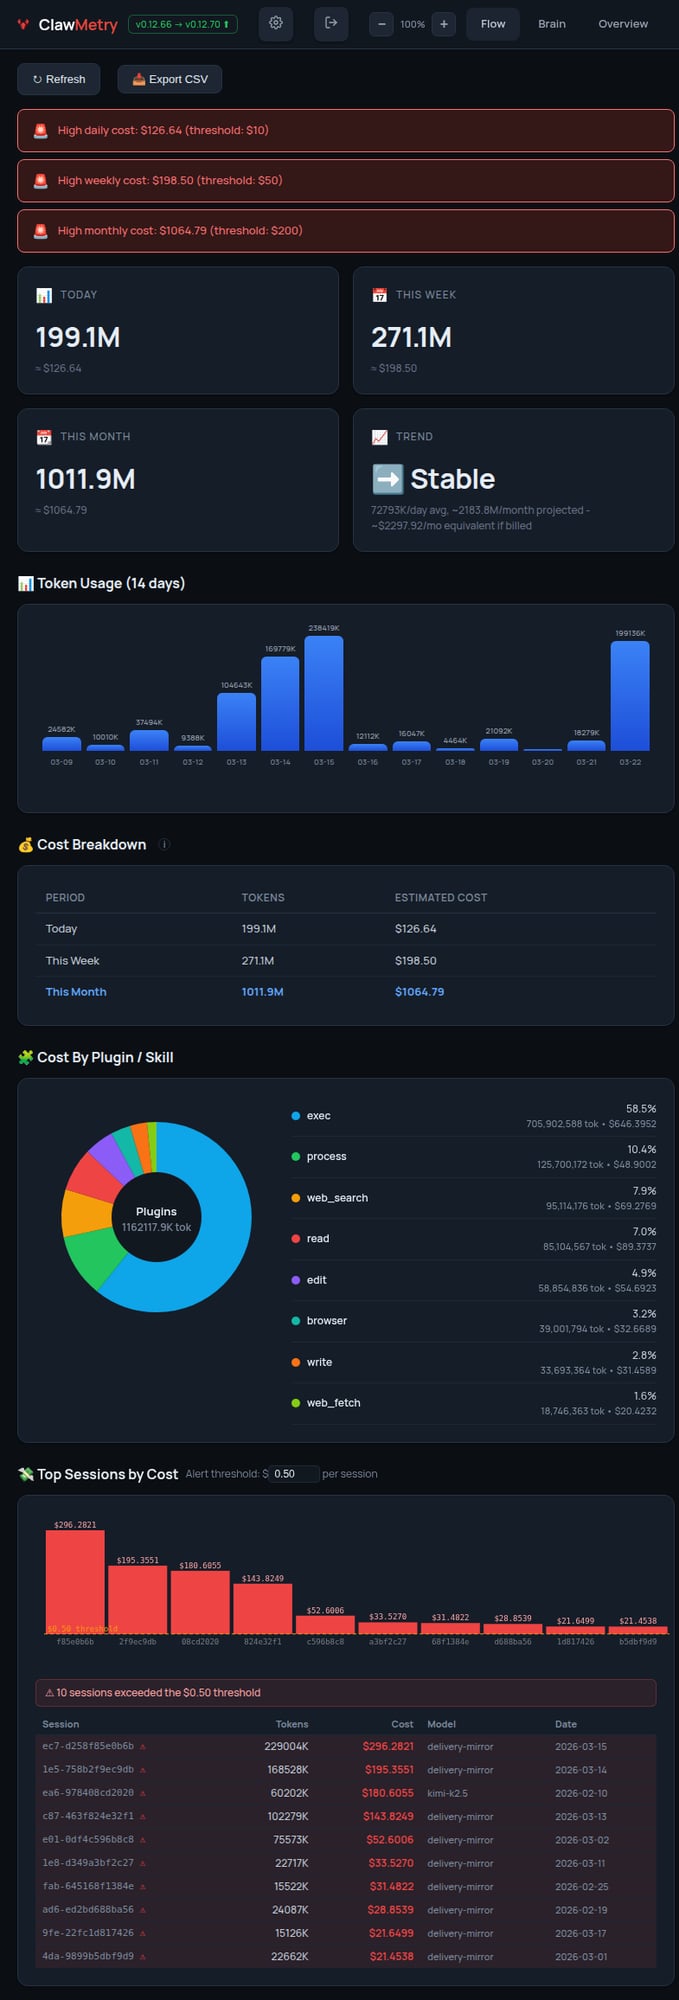
- Usage — Token and cost tracking with daily/weekly/monthly breakdowns
- Sessions — Active agent sessions with model, tokens, last activity
- Crons — Scheduled jobs with status, next run, duration
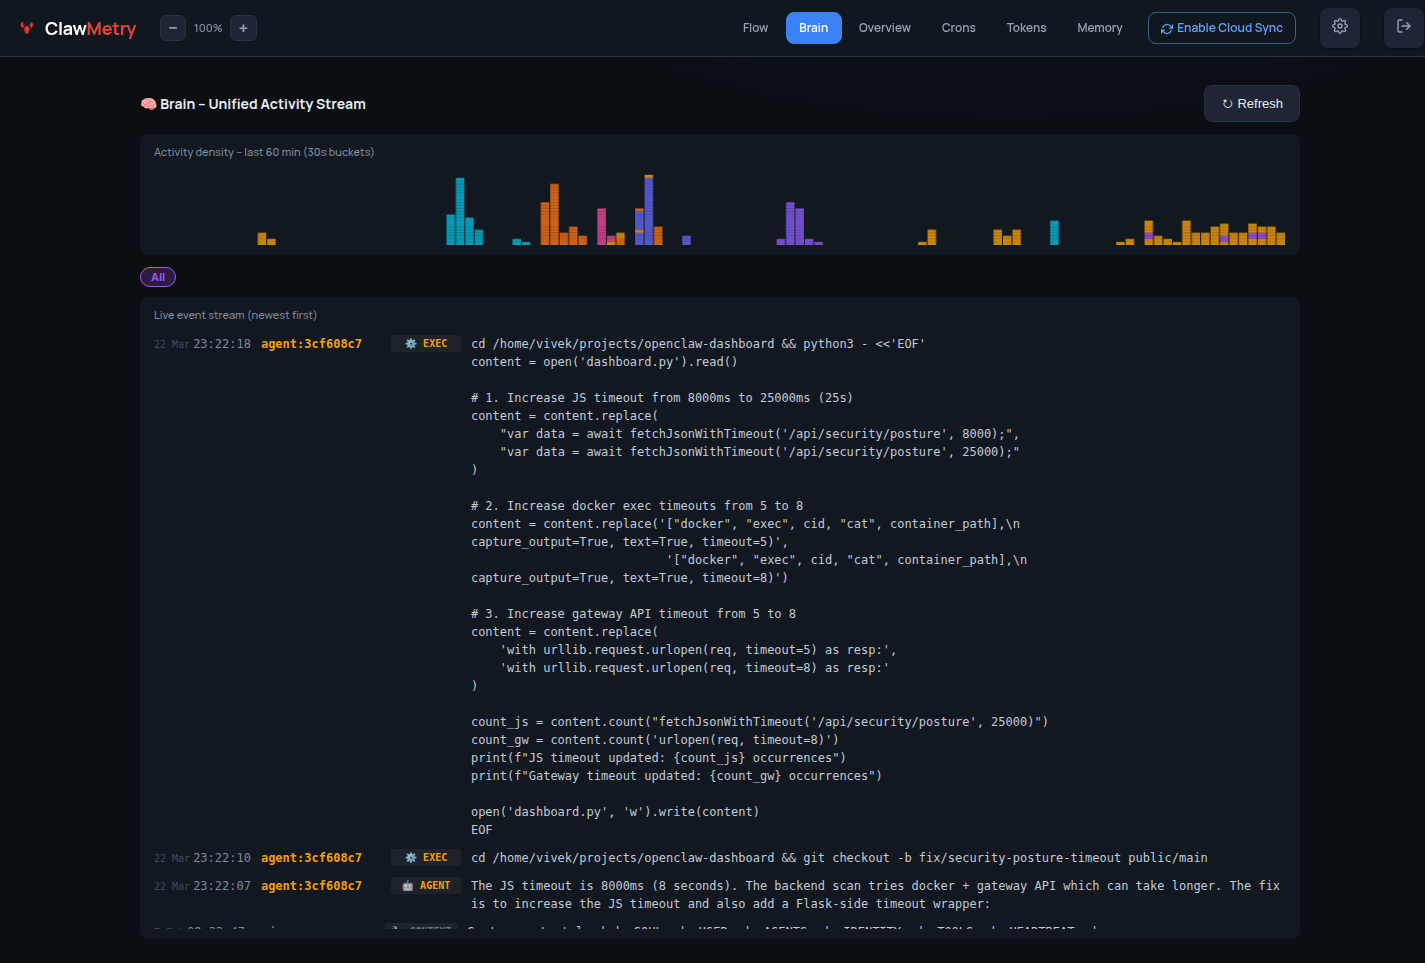
- Logs — Color-coded real-time log streaming
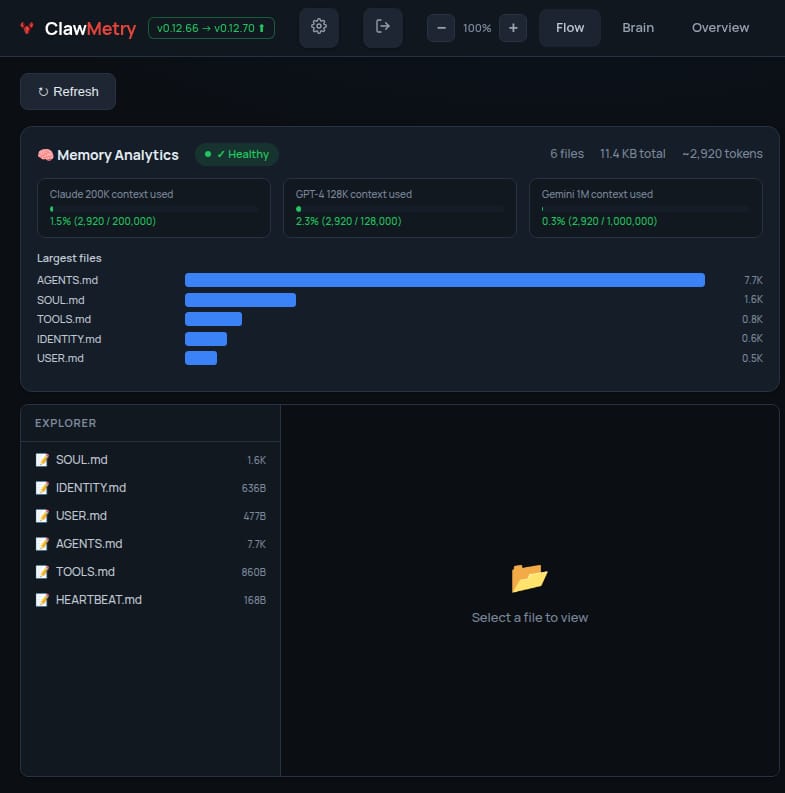
- Memory — Browse SOUL.md, MEMORY.md, AGENTS.md, daily notes
- Transcripts — Chat-bubble UI for reading session histories
One-liner (recommended):
curl -sSL https://raw.githubusercontent.com/vivekchand/clawmetry/main/install.sh | bashpip:
pip install clawmetry
clawmetry
From source:
git clone https://github.com/vivekchand/clawmetry.git
cd clawmetry && pip install flask && python3 dashboard.pyMost people don't need any config. ClawMetry auto-detects your workspace, logs, sessions, and crons.
If you do need to customize:
clawmetry --port 9000              # Custom port (default: 8900)
clawmetry --host 127.0.0.1         # Bind to localhost only
clawmetry --workspace ~/mybot      # Custom workspace path
clawmetry --name "Alice"           # Your name in Flow visualization
All options: clawmetry --help
ClawMetry shows live activity for every OpenClaw channel you have configured. Only channels that are actually set up in your openclaw.json appear in the Flow diagram — unconfigured ones are automatically hidden.
Click any channel node in the Flow to see a live chat bubble view with incoming/outgoing message counts.
| Channel | Status | Live Popup | Notes |
|---|---|---|---|
| 📱 Telegram | ✅ Full | ✅ | Messages, stats, 10s refresh |
| 💬 iMessage | ✅ Full | ✅ | Reads ~/Library/Messages/chat.db directly |
| ✅ Full | ✅ | Via WhatsApp Web (Baileys) | |
| 🔵 Signal | ✅ Full | ✅ | Via signal-cli |
| 🟣 Discord | ✅ Full | ✅ | Guild + channel detection |
| 🟪 Slack | ✅ Full | ✅ | Workspace + channel detection |
| 🌐 Webchat | ✅ Full | ✅ | Built-in web UI sessions |
| 📡 IRC | ✅ Full | ✅ | Terminal-style bubble UI |
| 🍏 BlueBubbles | ✅ Full | ✅ | iMessage via BlueBubbles REST API |
| 🔵 Google Chat | ✅ Full | ✅ | Via Chat API webhooks |
| 🟣 MS Teams | ✅ Full | ✅ | Via Teams bot plugin |
| 🔷 Mattermost | ✅ Full | ✅ | Self-hosted team chat |
| 🟩 Matrix | ✅ Full | ✅ | Decentralized, E2EE support |
| 🟢 LINE | ✅ Full | ✅ | LINE Messaging API |
| ⚡ Nostr | ✅ Full | ✅ | Decentralized NIP-04 DMs |
| 🟣 Twitch | ✅ Full | ✅ | Chat via IRC connection |
| 🔷 Feishu/Lark | ✅ Full | ✅ | WebSocket event subscription |
| 🔵 Zalo | ✅ Full | ✅ | Zalo Bot API |
Auto-detection: ClawMetry reads your
~/.openclaw/openclaw.jsonand only renders the channels you've actually configured. No manual setup required.
Want to run ClawMetry in a container? No problem! 🐳
Quick start with Docker:
# Build the image
docker build -t clawmetry .

# Run with default settings
docker run -p 8900:8900 clawmetry

# Or with your OpenClaw workspace mounted
docker run -p 8900:8900 \
  -v ~/.openclaw:/root/.openclaw \
  -v /tmp/moltbot:/tmp/moltbot \
  clawmetry
Docker Compose example:
version: '3.8'
services:
  clawmetry:
    build: .
    ports:
      - "8900:8900"
    volumes:
      - ~/.openclaw:/root/.openclaw:ro
      - /tmp/moltbot:/tmp/moltbot:ro
    restart: unless-stopped
Note: When running in Docker, make sure to mount your OpenClaw workspace and log directories so ClawMetry can auto-detect your setup.
- Python 3.8+
- Flask (installed automatically via pip)
- OpenClaw running on the same machine (or mounted volumes for Docker)
- Linux or macOS
ClawMetry automatically detects NemoClaw — NVIDIA's enterprise security wrapper for OpenClaw that runs agents inside sandboxed OpenShell containers.
No extra configuration is needed in most cases. The sync daemon auto-discovers session files whether they live in ~/.openclaw/ on the host or inside an OpenShell container.
ClawMetry detects NemoClaw in two ways:
- Binary detection — checks for the
nemoclawCLI and runsnemoclaw statusto get sandbox info - Container detection — scans running Docker containers for
openshell,nemoclaw, orghcr.io/nvidia/images, then reads sessions via volume mounts ordocker cp
Session files synced from NemoClaw containers are tagged with runtime=nemoclaw and container_id metadata in the cloud dashboard, so you can tell them apart from standard OpenClaw sessions at a glance.
For the best experience, run ClawMetry's sync daemon on the host machine (not inside the sandbox). This avoids NemoClaw network policy restrictions.
# On the host (outside the sandbox)
pip install clawmetry
clawmetry connect
clawmetry sync
The sync daemon will automatically find sessions inside any running OpenShell containers.
If auto-detection doesn't work, point ClawMetry at the right sandbox:
export NEMOCLAW_SANDBOX=my-sandbox-name
clawmetry syncIf you must run the sync daemon inside the OpenShell sandbox, add this egress rule to your NemoClaw network policy so it can reach the ClawMetry ingest API:
# nemoclaw-policy.yaml
network:
  egress:
    - host: ingest.clawmetry.com
      port: 443
      protocol: https
Apply with:
nemoclaw policy apply --file nemoclaw-policy.yaml| Endpoint | Port | Protocol | Required |
|---|---|---|---|
ingest.clawmetry.com |
443 | HTTPS | Yes (sync daemon → cloud) |
localhost:8900 |
8900 | HTTP | Yes (local dashboard UI) |
Docker socket (/var/run/docker.sock) |
— | Unix socket | For container session discovery |
The sync daemon only makes outbound HTTPS calls to ingest.clawmetry.com. No inbound ports are required.
See the Cloud Testing Guide for SSH tunnels, reverse proxy, and Docker.
This project is tested with BrowserStack.
MIT
🦞 See your agent think
Built by @vivekchand · clawmetry.com · Part of the OpenClaw ecosystem