Introduction to El MAVEN UI and Usage

El-MAVEN Workflow. Peak detection, alignment, grouping and scoring are done multiple times for best results. Data from different cohorts can be compared using visualization tools and easily exported to other formats.
- 1. El-MAVEN UI
- 2. Global Settings
- 3. Load Sample Files
- 4. Load Compound Database
- 5. EIC Widget
- 6. Mass Spectra
- 7. Alignment
- 8. Alignment Visualizations
- 9. Isotope Settings
- 10. Peak Detection
- 11. Peak Table
- 12. Statistical Module
- 13. Export Options

Global Settings can be changed from the Options dialog. 
Instrumentation

- Polarity/Ionization mode- Polarity information is required for m/z calculation. Users can set the polarity of the metabolites in their experiment from the drop-down list or set it to Auto-detect. The Auto-detect option will automatically detect the polarity of the uploaded files.
- Ionization type- Ionization methods can affect m/z calculation. Drop-down provides a list of the most commonly used ionization types.
- Q1 accuracy- This is the mass resolution in amu of the first quadrapole.
- Q3 accuracy- This is the mass resolution in amu of the third quadrapole.
- Filterline- The drop-down lists different mass ranges and allows the user to process the data in these ranges separately with different parameters. This option is primarily used for polarity-switching experiments.
File Import

- Centroid Scans- Centroid acquisition is an acquisition method where only centroid m/z and intensity are stored. Centroid m/z is calculated based on the average m/z value weighted by the intensity and m/z values are assigned based on a calibration file. Users may leave the box unchecked if they already have centroid data.
- Scan Filter Polarity- Users can choose to import scans based on the polarity of ions in the scan. This is helpful, especially in polarity-switching experiments.
- Scan Filter MS Level- Users can choose to import only MS1 or MS2 scans. This feature can be used with MS/MS data.
- Scan Filter Minimum Intensity- Users can set a minimum threshold for reading the intensity values.
- Scan Filter Intensity Minimum Quantile Cutoff- This option filters out scans with x% of the intensity values below the threshold during import.
- Enable Multiprocessing- In order to reduce the sample load time, El-MAVEN uses multiprocessing. Users can check/uncheck this option based on the type and size of the data.
Peak Detection

Peak Detection and Grouping Settings
- EIC Smoothing Algorithm- Smoothing of data points helps in increasing the signal/noise ratio. There are three algorithms provided for EIC smoothing: a) Savitzky-Golay- This algorithm preserves the original shape and features of the signal better than most other filters (Learn more) b) Gaussian- This algorithm reduces noise by averaging over the neighborhood with the central pixel having higher weight but successfully preserves the sharp edges. Learn more c) Moving Average- This algorithm takes the simple average of all points over time. The least preferred method for smoothing as its signal behavior is not natural. (Learn more)
- EIC Smoothing Window- Users can adjust the number of scans used for fitting in the smoothing algorithm.
- Max Retention Time Difference Between Peaks- Users can set a limit to RT difference between peaks in a group. Increase the value if alignment fails to center peaks as expected.
Baseline Calculation
- Drop top x% intensities from chromatogram- The baseline for every peak can be set by the user. A baseline is obtained once x% of the highest intensities in a peak are removed from consideration. Baseline should be set high when there is more noise in the data.
- Baseline Smoothing- When measuring a number of peaks, it is often more effective to subtract an estimated baseline from the data. This baseline should be set where ideally no peaks occur. Although sometimes the program sets a particular baseline such that one or more peaks occur below that baseline value. Users can adjust number of scans used for fitting in the smoothing algorithm here.
Peak Filtering images/peak_filtering.png
Isotope Peak Filtering is the same as Peak Filtering- User can check/uncheck this option if parameters in Isotope Peak Filtering should be the same as Parent Peak Filtering.
Parent Peak Filtering
- Min. Signal Baseline Difference- Minimum difference between intensity and baseline to detect any signal as a valid peak can be set using this option.
- Min. Peak Quality-
EIC (XIC) [BETA]

- EIC Type- User can select a method to merge EICs over m/z. It consists of two options: a) MAX- Merged EIC is created by taking the maximum intensity across the m/z window at a particular scan. b) SUM- Merged EIC is created by taking the sum average of intensities across the m/z window at a particular scan.
Peak Grouping

- Peak Grouping Score - Peaks are assigned a grouping score to determine whether they should be grouped together. There are two formulas for grouping score calculation: a) score = 1.0/((distXA)+0.01)/((distYB)+0.01)(Coverlap) b) score = 1.0/((distXA)+0.01)/((distYB)+0.01)
The score depends on the following parameters and their weights:
a) RT difference or DistX- This denotes the difference in RT between the peaks under comparison. Closer the peaks are assigned higher the score.
b) Intensity difference or DistY- This denotes the difference in intensity between peaks under comparison. The smaller difference accounts for a higher score.
c) Overlap- This denotes the fraction of RT overlap between the peaks under comparison. Greater the overlap higher the score.
- Consider Overlap- Uncheck this box if the user wants to calculate grouping score without overlap.
- Sliders are provided to adjust the weights attached to each of the three parameters.
Peak grouping is an integral part of the El-MAVEN workflow that categorizes all detected peaks into groups on the basis of certain user-controlled parameters. A group score is calculated for every peak during the process. The formula for this score takes into account the difference in Rt and intensities between peaks (smaller difference leads to a better score) and any existing overlap between them (higher extent of overlap leads to better score). All three parameters have certain weights attached to them that can be controlled by the user. The formula for the score is shown in the image.


The above image shows two groups in the EIC window. The highlighted (solid circles) peaks belong to group A, the peaks to its left with empty circles belong to another group B. The short peaks in group A that are close to the baseline and peaks in group B come from the same samples. Additionally, the high-intensity peaks of group A have a similar peak shape to group B peaks. These peaks might have been wrongly classified into separate groups because of the difference in RT range of the two sets of peaks. The weights attached to the difference in RT and intensities, and extent of overlap can be adjusted for better grouping.


Giving less priority to differences in RTs and intensities results in the two groups being merged into a single group while the peaks that lay close to the baseline are no longer classified as valid peaks.
Group Rank
![]()
-
Group Rank Formula- Group rank is one of the parameters for group filtering. It consists of two formulas for group rank calculation:
a) Group Rank = ((1.1 - Q)^A) * (1 /( log(I + 1))^B)
b) Group Rank = ((1.1 - Q)^A) * (1 /( log(I + 1))^B) * (dRT)^(2*C)
The score depends on the following parameters and their respective weights A, B, and C:
i) Q or Group Quality- This denotes the maximum peak quality of a group. Here peaks are assigned a quality score by a machine learning algorithm in El-MAVEN. Better the quality of the peak higher the rank.
ii) I or Group Intensity- This denotes the maximum intensity of a group. Better intensity leads to a higher rank.
iii) dRT or RT difference- This denotes the difference between expected RT and group mean RT.
- Consider Retention Time- Users can check/uncheck the box to use formula (b) for group rank calculation. Formula (a) is used by default.
- Quality Weight- Slider can be adjusted to set weight for group quality in group rank calculation by the user.
- Intensity Weight- Slider can be adjusted to set weight for group intensity in group rank calculation by the user.
- dRT Weight- Slider can be adjusted to set weight for RT difference in group rank calculation by the user. The slider is disabled if Consider Retention Time is unchecked.
Load  sample files into El-MAVEN and click on Show Samples Widget
  on the widget bar to show/hide the project space. Blanks will not show up in the sample list if the file names start with 'blan' or 'blank'.

There are three columns in the project space:
- Sample: This column contains the sample name and the random color assigned to the sample. Double-click the sample name to change the color.
- Set: This column is filled by the user to enter cohorts each sample belongs to. Example: subjects and controls. This is optional.
- Scaling: This column holds the normalization constant for every sample. For example, all intensities in a sample will be halved if the constant is two. This is done to normalize data if sample volumes are different. This is optional.
- Injection Order: User can provide the order in which samples were injected into the Mass-spec. This is also optional.
- Sample Number: Users can assign samples numbers to the sample files uploaded.
Sample Space Menu
- Export Samples metadata
 - Exports a template file with sample names and which can be edited as a spreadsheet. This will ease the process of metadata file generation.
 - Load Metadata
 - This option enables users to upload metadata files containing Samples, Cohort, Scaling factor, and Injection Order columns. This file is in a comma-separated file (CSV format). Metafile template is shown below:

- Change Sample Color
 - Sample colors can be changed by either clicking on this menu button or double-clicking the sample name. Users can pick a color of their choice to represent their samples.
 - Remove Samples
 - Apart from deselecting samples, the user can also remove samples from the sample space.
 - Show/Hide Selected Samples
 - Samples can be selected/deselected in batches. This is especially helpful when dealing with large datasets as the EIC window gets increasingly messy with more samples.
 - Mark Sample As Blank
 - The user can select sample files and set them as blanks as depicted below. Clicking the button again will reverse the task.

A compound database file contains a list of metabolites and their properties that are used for peak detection. This is in the CSV or tab-separated (.tab) file containing compound name, id, formula, mass, expected retention time, and category. The mandatory spaces to be filled include the compound name and either mass or formula. Rest all is optional. In case both mass and formula are provided by the user, the formula will be used to calculate the m/z. El-MAVEN has two in-house databases that can be used for peak-picking at MS level ('KNOWNS') and SRM analysis ('SRM2'). The Show Compounds widget  on the widget toolbar enables the user to view the compounds panel.
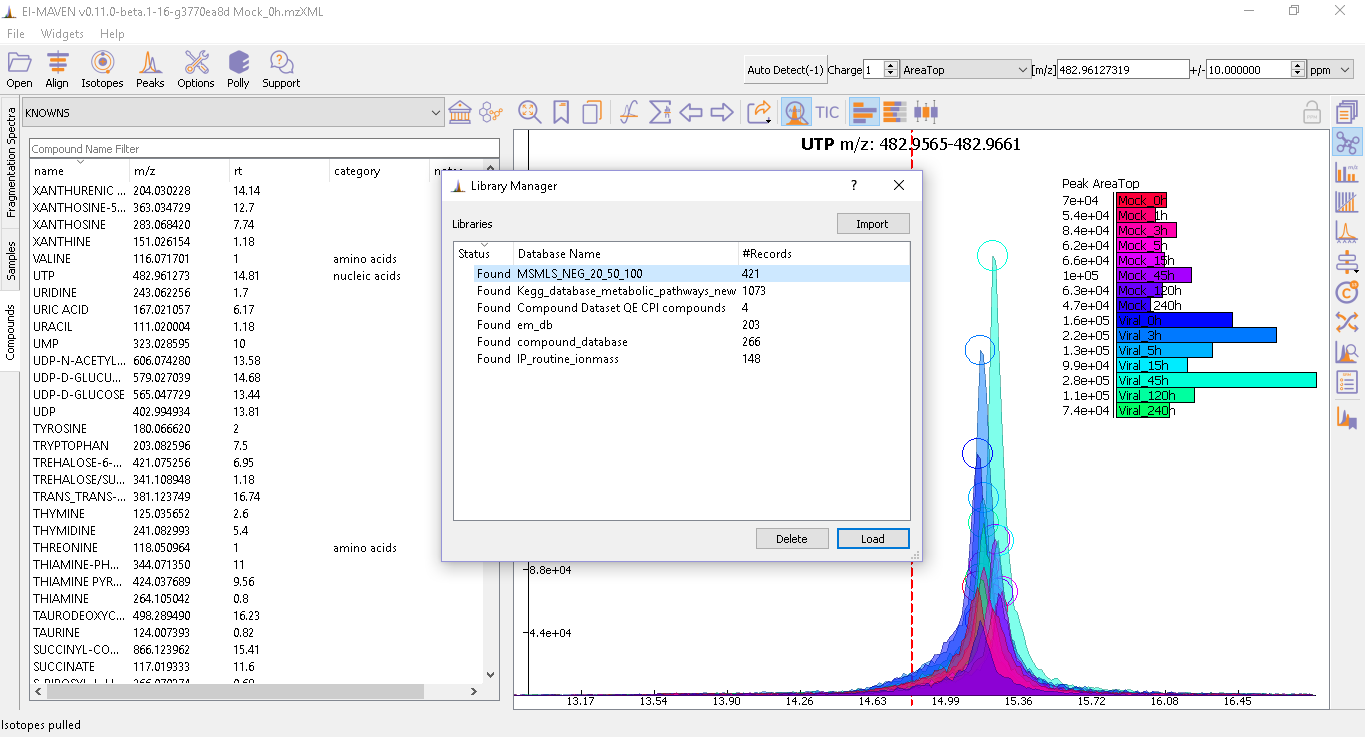
- Users can import their custom database by importing it from the local folder using
 Library Manager. If the compound database uploaded is shifted to another folder, the status of this database in Library Manager changes to 'Missing'. In this case, the user should re-import the database from the new folder. The figure below shows the Library Manager.
 An Extracted Ion Chromatogram is a graph of Intensity vs. RT for a certain m/z range. EIC window displays the EIC for every compound selected or m/z range provided. The compound name and/or the m/z range is displayed at the top. Following are the different toolbar options available on top of the EIC window:
- Zoom out
 - The EIC is by default zoomed-in to display the region near the expected RT of a group. This button will zoom out and display the whole RT range for the selected m/z range. Users can zoom in to a region by right-dragging the mouse over it. Left-dragging will zoom-out.
 - Bookmark Group
 - On clicking this option, the user can bookmark a peak group while performing manual curation. When a peak group is bookmarked, a red line appears on the X-axis (RT) showing RT range considered to calculate the area. This can also be done by Shift+Drag on the peak or double-clicking on the peak group of interest. A bookmark table is auto-generated upon using this option.
 - Copy Group Information to Clipboard
 - On clicking this option, group information is copied to the clipboard with every row representing a different sample.
 - History Back
 - EIC window display history is recorded. Clicking this button will display the previous state of the EIC window.
 - History Forward
 - EIC window display history is recorded. Clicking this button will display the next state of the EIC window if available.
 - Save As
 - Export the current EIC display in different formats. Clicking this button drops down the a menu where the user can select the following options:
 - Save EIC image to PDF file- Saves the current EIC window display in a PDF file.
- Copy EIC image to clipboard- Current EIC window display is copied to clipboard.
- Print EIC - Current EIC window display can be directly printed out.
- Auto Zoom
 - Auto Zoom is selected by default. It zooms-in and centers the EIC to the expected retention time. The expected retention time is depicted as a vertical-dashed red line.
 - Show TICs
 - Displays the Total Ion Current. TIC is the sum of all intensities in a scan.
 - Show Bar plot
 - Displays the peak intensity for a group in every sample. Intensity can be calculated by various methods known as quantitation types in El-MAVEN. Users can change the quantitation type from the drop-down list on the top right or choose to display other parameters like retention time and peak quality.

- Show Isotope Plot
 - Displays the isotope plot for a group. Each bar in the plot represents the relative fractions (percentage) of different isotopic species for the selected group in a sample.

- Show Box plot
 - Displays the boxplot for a group. The box plot shows the spread of intensities in the group and where each peak lies in relation to the median. The median of the intensities is the vertical line between the boxes.
Apart from the top menu, there are other features in the EIC window. Right-click anywhere in the window and go to Options.

Some of the important options are:
- Show Peaks - Peaks are marked by the colored circles that represent the quality score of the peak. Bigger the circle, better the peak quality. This option allows the user to show/hide the peak quality score.
- Group Peaks Automatically - Peak grouping happens automatically when grouping parameters are changed. To prevent automatic grouping, the user can uncheck this option.
- Show Baseline - Hide/Show the baseline for every peak.
- Show Merged EIC - Merged EIC is the sum average of EICs across samples. It smoothens the data and helps in grouping peaks.
- Show EIC as lines - In the case of a large number of samples, it can get difficult to look at short individual peaks as they are obscured by larger peaks. Showing EIC as lines clean up the display window and allows the user to look at small peaks.
Mass Spectra Widget displays each peak, its mass, and intensity for a scan. As the widget shows all detected masses in a scan, the ppm window for the EIC and consequently grouping can be adjusted accordingly. This feature is especially useful for MS/MS data and isotopic detection. When focused, the user can navigate between last and next scans using left and right arrow keys respectively.

Prolonged use of the LC column can lead to a drift in retention time across samples. Alignment shifts the peak RTs in every sample to correct for this drift and brings the peaks closer to the median RT of the group.
Click on the Align button  and adjust the settings.

There are three different algorithms for aligning peaks across samples:
1. OBI-Warp
2. Poly fit
OBI-Warp: This is the best of all three algorithms which align scan data by taking one of the samples for reference RT values.
-
Choose Reference Sample: This option is for choosing a reference sample from the list of samples, which would be used as a reference to perform alignment on other sample groups.
-
Advanced parameters for OBI-Warp: In case, the user wants to look at advanced parameters, check on 'Show advanced Parameters' option. It shows the advanced parameters for the OBI-Warp algorithm. The default values set here work well for most chromatographic data.
-
- Score:
 For scoring there are four options available:
i. cor-correlation
ii. cov-covariance
iii. prd-product
iv. euc-euclidean distance
Depending on the selection of these scores, OBI-warp tries to optimize it by making a similarity map.
For scoring there are four options available:
i. cor-correlation
ii. cov-covariance
iii. prd-product
iv. euc-euclidean distance
Depending on the selection of these scores, OBI-warp tries to optimize it by making a similarity map.
- Score:
-
- Response:
-
- Gap-init: In cases, where 2 compounds have RTs close enough, Gap init is penalty value used to create a similarity matrix to achieve the best alignment.
-
- Factor diag:
-
- Bin size:
-
- Gap-extend: In cases, where 2 compounds have RTs close enough, Gap-extend is penalty value used to create a similarity matrix to achieve the best alignment.
-
- Factor-gap:
-
- Local:
-
Reset advanced parameters : This option resets the default parameters set for chromatographic alignment.
Poly-Fit : This algorithm performs automated group detection and then aligns them. [images/alignment_poly-fit.png]]
-
Maximum number of Iterations : This parameter is only required for Poly-fit algorithm. Enter the number of times El-MAVEN should fit a model to the data in order to align it.
-
Polynomial Degree : This is the degree of the non-linear model we are trying to fit for Poly-fit algorithm. Recommended settings are entered by default.
-
Group Selection Criteria for use in alignment : 'Group' here refers to a set of peaks across samples that is annotated as a particular ion.
-
- Group must contain at least [X] good peak: The value of x is set to filter out groups that do not have at least x good peaks from the alignment process. As there is only one peak per sample for a group, this value should not exceed the number of samples in your project. This option allows the user to discard groups with very few good peaks under the assumption that those could be stray peaks.
-
- Limit total number of groups in alignment to: User can change the number of groups being used for alignment in case there are too many groups detected after the peak detection process.
-
- Peak Grouping Window: This value controls the number of scans required to get the most accurate peaks. Enter a high number if the reproducibility is low to ensure the best results.
-
Peak Selection settings_ :
-
- Minimum Peak Intensity: The intensity value can be adjusted to only look at high or low-intensity peaks in case you have prior information about the concentration of metabolite you are looking for.
-
- Minimum peak S/N ratio: This is the minimum signal to noise ratio of your experiment. Increase the value if you see too much noise in the data.
-
- Minimum Peak Width: This is the least number of scans to be considered to evaluate the width of any peak. -
-
- Peak Detection Algorithm: Select the Compound Database Search algorithm and then choose an appropriate database from the next drop-down menu.
Finally, the Align button at the bottom can be clicked to start alignment process. The progress bar informs the user about the status of completion. Alignment can be canceled at any time while the operation is going on, which will roll back all the changes done to scan data. Even after the completion of the alignment, the user can revert back to the (unaligned) original state by clicking the Undo Alignment button, which only becomes active once the alignment process has been completed, at least once.
El-MAVEN provides three visualizations for alignment analysis.
- Show Alignment Visualization: This icon
 in the widget bar opens visualization to view alignment. Click on any grouped peak to look at R-squared and compound RT values before and after alignment as shown.

There are 3 different options to view the aligned peak groups, namely:
- Per Group Deviation:

- Sample Deviation:

- All Groups Deviation: images/align_viz_all_group_dev.png

The above graphs give a clear indication of how aligned/misaligned the peaks are. Users may run alignment again with different parameters if required (or with a different algorithm).
Peak detection algorithm pulls the EICs, detects peaks, and performs grouping and filtering based on parameters controlled by the user. The algorithm groups identical peaks across samples and calculates the quality score by a machine learning algorithm. Click on the Peaks icon  on the top to open the settings dialog.
There are 2 tabs for setting Peak Detection parameters:
a) Feature Detection Selection

The first panel has the following parameters:
-
Automated Feature Detection- This is one of the two strategies for finding peaks. Automated search creates thousands of mass slices across the whole m/z and retention time-space to find all peaks present in the sample. This strategy is used when looking for new/unknown metabolites in the samples. This method is also called Discovery Metabolomics or Untargeted Metabolomics and this can be performed at both MS and MS/MS levels.
-
Mass Domain Resolution- This value defines the m/z range of every mass slice in parts per million.
-
Time Domain Resolution- This value defines the scan range (or retention time range) of every mass slice.
-
Limit Mass Range- User can limit the automated search to a range of m/z according to their requirements.
-
Limit Time Range- User can limit the automated search to a retention time range according to their requirements.
-
Identify using database- This feature allows users to select the database (uploaded from Library manager) to match features detected with the metabolites present in the database based on their m/z information. In case, the user wants to detect only features, let the option be set to 'None'.
-
Match Retention Time (+/-)- In case the user opts to use the compound database and, the database contains RT information, this option can be used to match peak groups based on the RT information.
-
Compound Database Search- Database search is used to search for compounds listed in the reference file using their m/z information. For better accuracy, retention time information can also be used for the search. This algorithm is selected for Targeted experiments like MRM/SRM and Labeled experiments.
-
Select database- Select the desired reference file for the search from the drop-down list.
-
EIC Extraction Window (+/-)- Provide a ppm buffer range to all compound masses. A larger window is useful for processing low-resolution data. The window should be smaller for high-resolution data to reduce noise.
-
Match Retention time (+/-)- This option is in the form of a checkbox. Users can enable/disable the use of retention time information along with m/z to perform database search. Compounds can have different retention times in every experiment, therefore this option should only be checked if the reference file is specific to the experiment and the sampled used. Enter the time buffer in the accompanying box.
-
Limit number of Reported Groups per Compound- This option is to select the number of best groups that fall within the range of the 'Match Retention Time' option above.
-
Detect Adducts within- This can be checked/unchecked if adduct information is needed by the user. Users will have to enter the time range and percentage correlation of adducts to be detected with respect to the Parent ion.
-
Match Fragmentation- This panel is activated for MS/MS data. This can be used in combination with either Automated Feature Detection or Compound Database Search algorithm. For this purpose, the database to be used should be of .mgf/.msp format, which contains the spectral information of each compound present in the database.
-
Fragment Mass tolerance- This option is required to set the fragment mass tolerance required to perform feature detection or compound database search. Higher the ppm value, the lesser will be the quality of data acquired. It works on the same ideology as that of a Mass-spec experiment.
-
Match at least X fragments- User can provide the number of at least X fragments that should match with the overall spectra
-
Scoring algorithm-
-
Minimum Score- This is a probabilistic score defining how sure El-MAVEN is about the matching of reference and group peaks and that it is not a random encounter. It basically correlates group spectra to reference and provides the score to give the likelihood of being random.
-
Exclude unfragmented groups- This option can be enabled/disabled by the user if unfragmented groups have to be detected or not.
The EIC Extraction Window should be set according to the instrument's resolving power. Select the Match Retention Time option if you wish to search for compounds using both the m/z ratio and rt value given in the database. In the case of a generic database, searching by retention time is not recommended.
b) Group Filtering

After grouping is done, groups that do not fulfill the criteria shown above are filtered out.
-
Minimum Peak Intensity- Groups with no peak intensities above this threshold are filtered out. The drop-down list beside the input box defines how intensity is calculated. Different methods of intensity calculation are known as quantitation types. The slider below can be adjusted to change the minimum percentage of peaks per group that must pass the threshold (minimum number of peaks is 1).
-
Minimum Quality- Quality of peaks is calculated using a machine learning algorithm. Groups with no peak qualities above this threshold are filtered out. The slider below can be adjusted to change the minimum percentage of peaks per group that must pass the threshold (minimum number of peaks is 1).
-
Minimum Signal/Blank Ratio- Signal/Blank ratio is the ratio of peak intensity over maximum intensity observed in blanks. Groups with no peaks above this threshold are filtered out. The slider can be adjusted to change the minimum percentage of peaks per group that must pass the threshold (minimum number of peaks is 1). This helps in filtering out peaks that are also present in blanks.
-
Minimum Signal/Baseline Ratio- Signal/Baseline ratio is the ratio of peak intensity over baseline value for that peak. Baseline calculation is used to filter out noise in the signal and will be discussed later in the tutorial. The slider can be adjusted to change the minimum percentage of peaks per group that must pass the threshold (minimum number of peaks is 1).
-
Minimum Peak Width- Peak width is equal to the number of scans that a peak is spread over. Groups with no peak widths above this threshold are filtered out. Spurious signals can be filtered out using this option.
-
Minimum Good Peak/Group-
-
Peak Classifier Model File- This is the default model that is used by the machine learning algorithm for classifying peaks according to their quality.
Change the settings according to the data and click on Find Peaks to run peak detection. For beginners, performing peak detection with default values at first is recommended. Users may then adjust the settings depending on their results.

Report Isotopes - Check this option if the user wants to perform labeled analysis. This option should be checked/unchecked before performing automated/manual peak picking based on the type of analysis. Isotopic tracer - El-MAVEN allows users to perform manual/automated peak detection for the following labels: D2, C13, N15, and S34. Isotope Filtering - Filter isotopic peaks based on the following criteria.
- Minimum Isotope-Parent Correlation- To set the minimum threshold for isotope-parent peak correlation. This correlation is a measure of how often they appear together.
-
Isotope is within [X] scans of parent- To set the maximum scan difference between isotopic and parent peaks. This is a measure of how closely they appear together on the RT scale.
Link isotope peak RT range with parent peak - In case user wants to match the RT ranges of the isotope peaks with the parent peak, this option can be checked.

 Group information obtained after Peak Detection is stored and displayed in the form of a Peak table with a row representing a group and its corresponding features in columns. Users can show/hide the peak table by clicking on
  on the widget bar.
Peak Table Features Following are the different features/columns in a peak table:
- #- This is the serial number for a metabolite peak group.
- ID- Group ID is assigned according to the search mode used during peak detection. In the case of Automated search, groups are named by their m/z and RT values separated by '@' sign. For example, ID for a group with 230.2 m/z and 1.89 RT will be given as '[email protected]'. In case of Database search, groups are annotated as a compound from the reference file. For example, 'malate'.
- Observed m/z- is the median m/z of the group.
- Expected m/z- is the m/z value provided in the reference file for the compound represented by the group. This field is populated only in case of Database search.
- rt- is the median RT of the group.
- rt delta- is the difference between expected RT from the reference file and the observed RT. This field is set to -1 in the case of Automated Search.
- #peaks- This is the number of peaks in the group.
- #good- This is the number of good peaks in a group. A good peak is defined as one with its quality score above the defined threshold in Peak Detection dialog.
- Max Width- This is the maximum peak width in a group. Peak width is defined as the number of scans over which a peak is spread.
- Max AreaTop- This is the maximum peak AreaTop intensity in a group. AreaTop is one of the quantitation types used to represent peak intensity in El-MAVEN. Read more about the different quantitation types here
- Max S/N- This is the maximum peak signal/noise ratio in a group.
- Max Quality- This is the maximum peak quality score in a group.
- MS2 Score- This is the score for MS2 features detected. this ranges from 0-1, with 0 being the least and 1 being the best score of a feature.
- #MS2 Events- This value gives information on how many times the fragments have been detected.
- Rank- is the group rank. The formula and parameters involved have been explained [here].
Peak table Menu Bar

Multiple groups can be annotated as the same compound especially when retention time information is not used during the database search. The peak table provides options for filtering, comparing, or exporting data from the table. Following are the different menu options available in the peak table:
-
 - This is the 'Switch between group and peak views' button. Switching to Peak view displays only Peak information. This includes group number, group ID, Expected m/z, Observed m/z, rt, and intensity of all peaks in the group with sample names as the respective column headers. Peak intensity cells are colored based on their relative values in a group. The highest intensity value has the lightest color and vice-versa.

-
 - The 'Mark Group as Good' is used to manually curate selected peaks as 'good'. User can also press 'G' on their keyboard for the same. Manual curation has been described here.

-
 - 'Mark Group as Bad' is used to manually reject peaks by marking them as 'bad'. User can also press 'B' on their keyboard for the same. Manual curation has been described here.

-
 - 'Unmark selected group from Good/Bad' is used to manually unmark any selected peak/group as 'Good' or 'Bad'. User can reverse the Good/Bad peak selection as shown in the picture below.

-
 - 'Delete Group' is used to manually remove a peak group completely from the list. If the user finds a peak group that is not needed for further analysis and/or is not needed, this option can be used to delete that peak group. This is not reversible.
 -
 - 'Peak Editor' is a striking feature added in this version. Users can manually edit the peak areas of individual samples, which results in re-calculation of peak area leading to an updated peak-table.
The automated peak detection performed sometimes does not cover the complete peak as it performs peak detection with universally set parameters, as shown below. User can see the peak RT covered to calculate the area, by looking at the red-line located below the EIC of every compound.  For cases like these, the peak editor allows the user to manually change the coverage of individual peaks. The picture below shows how the function looks, along with several functionalities that are required to re-calculated the area of the peak groups.

- Group Baseline Settings : This is the same parameter settings in the Peak Detection option for Baseline calculation. Details on how to adjust these parameters can be found [here].
- Editor Settings : The editor settings have the following options:
- Min. RT: This option sets the minimum RT required to perform the manual curation of peaks of individual samples. This can also be done by dragging the left-slider on the graph above.
- Max. RT: This option sets the maximum RT required to perform the manual curation of peaks of individual samples. This can also be done by dragging the right-slider on the graph above.
- Y-axis fits the highest peak in the group: This can be checked/unchecked by the user, based on the Y-axis covered in each peak. To apply the same Y-axis for shorter peaks the same as the highest peak, the user can enable this option. -4. Sync range of all other isotopologues: In the case of a Labeled experiment, the user can apply the same RT range selected during manual curation to all isotopologues. In case it is not checked, the iterations will only be applicable to the parent ion. For the Untargeted experiment, this option is not needed.
Users can select all samples at once and edit the Max. and Min. RT (applicable universally) or choose to individually edit for an individual sample. After performing the necessary changes, click on 'Apply Edits'. This will update the area covered in the peak table for that particular compound. the picture below shows the edited peaks and the recalculated area and other details on the peak table.
-
 - 'Settings Log' can be used by the user to check the log of settings used to perform the integration of selected peak-groups. A Settings log looks like the picture below.
El-MAVEN comes equipped with a statistics module for comparing data across different cohorts. Users can set the sample cohorts either by editing the Set column in the Sample space or upload a metadata file with sample and cohort names as detailed above under the "Sample space Menu" section.
The statistics module can be accessed through the Peak Table menu.

-
Set1/Set2- Select two cohorts to be compared
-
Min Log2 Fold Diff- Fold difference is a measure of how much the intensity of a group changes from one cohort to another. Users can set the minimum threshold for this value in log(base2) format.
-
Min Intensity- Groups with all peak intensities less than this value will be filtered out from the comparison process.
-
p-value- A t-test is performed to find if the intensity distributions of the two selected cohorts are significantly different from each other. This test returns a p-value indicating how significantly different a group behaves between the two cohorts. A lower p-value show higher significance.
-
Set Missing Values- User can set the default intensity value to be used in case the group is missing from a sample.
-
Min. Good Sample- Groups should have a minimum number of good peaks (based on peak quality score) to be considered for comparison.
-
FDR Correction- False discovery rate is the expected proportion of false positives in a test. There are a number of ways to correct for false positives. (Read More)
-
Zoom out
 - Zoom out of the plot.
 -
 - Opens the Compare samples dialog again to adjust settings.
 -
Scatter Plot
 - The axes represent the average peak intensity (Peak Height) for samples 1 and 2 respectively. Each bubble is a group. The bubble size represents fold change between the samples. The significance (or p-value) of the fold change is represented by the bubble color. Red and blue signify higher intensity in samples 1 and 2 respectively. The opaqueness of the bubble represents the significance (or inverse of p-value) of the fold change between cohorts.
 -
Volcano Plot
 - The axes represent Fold change and significance of fold change respectively. Red and blue bubbles represent positive and negative fold change.
 -
Delete
 - Delete a data point from the graph.
 -
Scatter Plot Table
 - A separate Peak table is created with all filtered groups being used for statistical analysis. Users can also export these in a CSV or JSON format.
-
Export PDF
 - This option enables users to export selected or all peak groups from the peak table containing their EICs, adduct, intensity, and m/z information into a PDF report as shown below.
-
Export CSV
 - This option enables users to export peak groups from the peak table in Group Summary (CSV format) or Peak-detailed Format (CSV Format). Users can filter out metabolites based on the following options available while exporting, as shown in the picture below. These files can readily be used as input files for a wide range of Polly Metabolomics workflows and Apps.
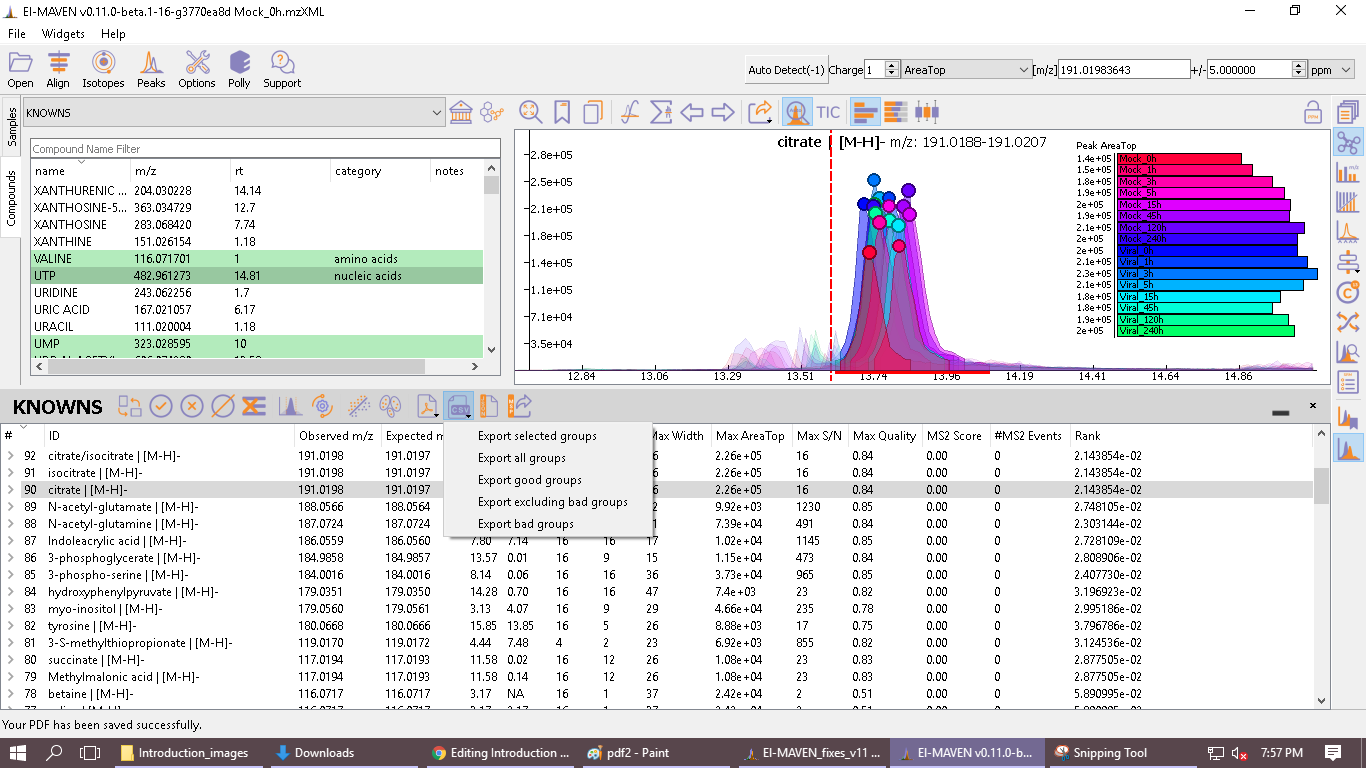
-
Export EICs to JSON
 - This option enables users to export all the EICs to JSON format.
 -
Export table as spectral library
 - This option enables users to export all the peak table to .msp format containing spectral information. This case is used when the data contains MS2 information.
After all the above iterations are performed, the user can either save the state of the project or export only relevant data from the peak table.
-
Save Project As- This option is available in the File menu. It saves all peak tables and current settings in an 'emDB' Project file.
