Untargeted LC MS and LC MS MS Workflow
- 1. Preprocessing
- 2. Launch El-MAVEN
- 3. Adjust Global Settings
- 4. Load Samples
- 5. Load Compound Database
- 6. Isotope Settings
- 7. Alignment
- 8. Peak Grouping
- 9. Baseline smoothing
- 10. Manual Peak Settings
- 11. Mass Spectra Widget
- 12. Peak Curation
- 13. Peak Table
- 14. Export Options
Follow the following steps to perform Untargeted LC-MS analysis.
msConvert is a command-line/ GUI tool that is used to convert between various mass spectroscopy data formats, developed and maintained by proteoWizard. Raw data files obtained from Mass Spectrometers need to be converted to certain acceptable formats before processing in El-MAVEN.
Input- msConvert supports the following formats:
- .mzXML
- .mzML
- .RAW Thermofisher
- .RAW Walters
- .d Agilent
- .wiff format ABSciex
The settings used for msConvert as a GUI tool are captured in the following picture:

NOTE: Zlib compression is enabled by default in msConvert. El-MAVEN now supports Zlib compression.
Once sample files are ready for processing, launch El-MAVEN.

Global Settings can be changed from the Options dialog  . There are 9 tabs in the dialog. Each of these tabs has parameters related to a different module in El-MAVEN.

To know more about the functionality of different tabs and their settings, go to Widgets page. Please be sure to set the desired settings before processing an input file.
Load sample files by clicking on Open ![]() . Navigate to the folder containing the sample files in .mzXML or .mzML files and click Open. A loading bar displays the uploading progress at the bottom.
. Navigate to the folder containing the sample files in .mzXML or .mzML files and click Open. A loading bar displays the uploading progress at the bottom.
 When the samples have loaded, the user should see a sample panel on the left side. If it is not displayed automatically, click on the Show Samples Widget
  option on the toolbar. El-MAVEN automatically assigns a color to every sample. Users can select/deselect any sample by clicking the checkbox on the left of the sample name.
 Users can select sample files and mark them as blanks by using the 'Set As a Blank Sample'
 ![]() option located in the sample space menu. Clicking the button again will reverse the task. Otherwise, before uploading the samples, the user can rename the blank samples as 'blan' or 'blank'. After uploading, these will be color-coded as black.
option located in the sample space menu. Clicking the button again will reverse the task. Otherwise, before uploading the samples, the user can rename the blank samples as 'blan' or 'blank'. After uploading, these will be color-coded as black.
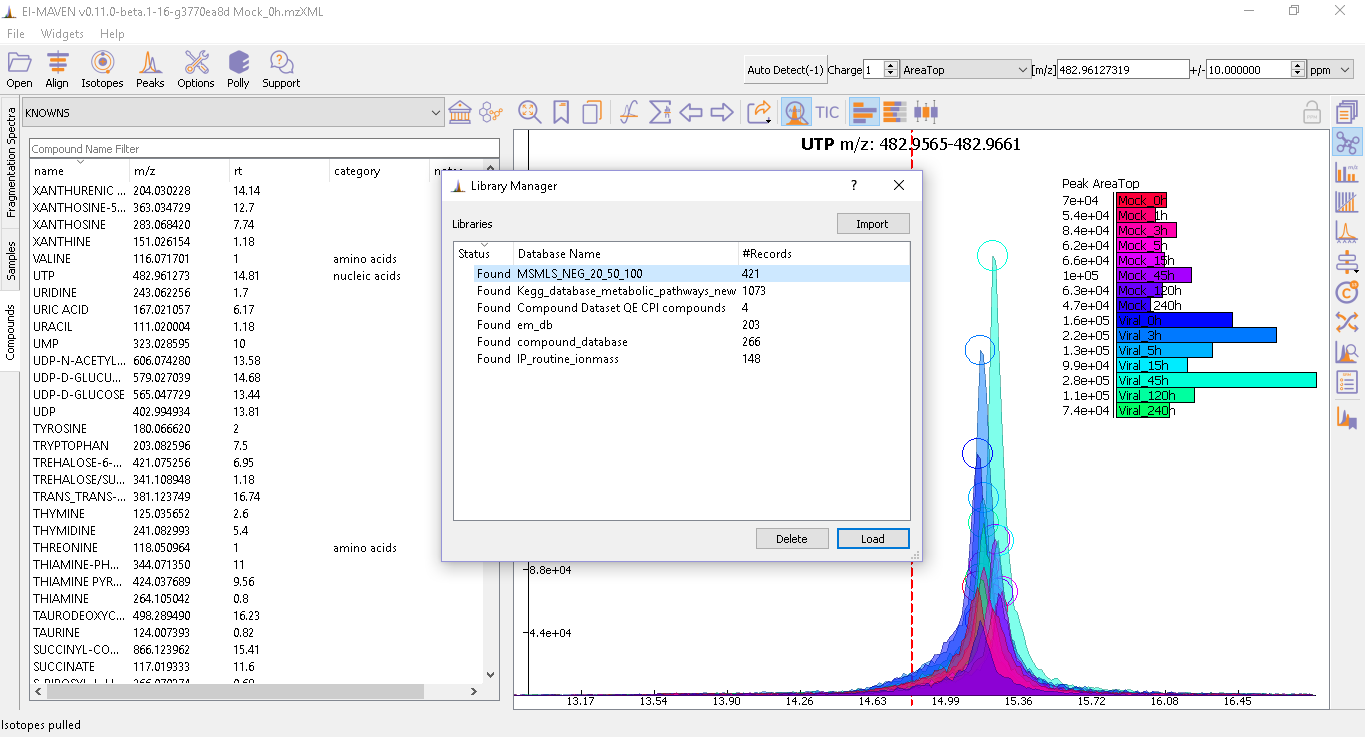
- Users can import their custom database (CSV format) by importing it from the local folder using Library Manager
 or use the in-house databases provided in the compound space dropdown namely: KNOWNS and SRM2. The former is used for any LCMS data, and the latter can be used for SRM experiments.
 - If the user uploads a custom database and the compound database uploaded is shifted to another folder, the status of this database in Library Manager changes to 'Missing'. In this case, the user should re-import the database from the new folder. The figure below shows the Library Manager.
 -A sample compound database looks like the picture below. The mandatory spaces to be filled include the compound name and either mass or formula. Rest all is optional. In case both mass and formula are provided by the user, the formula will be used to calculate the m/z.


Make sure that the_ Isotopes_ option is disabled/unchecked for any Untargeted analysis, as shown in the figure below.


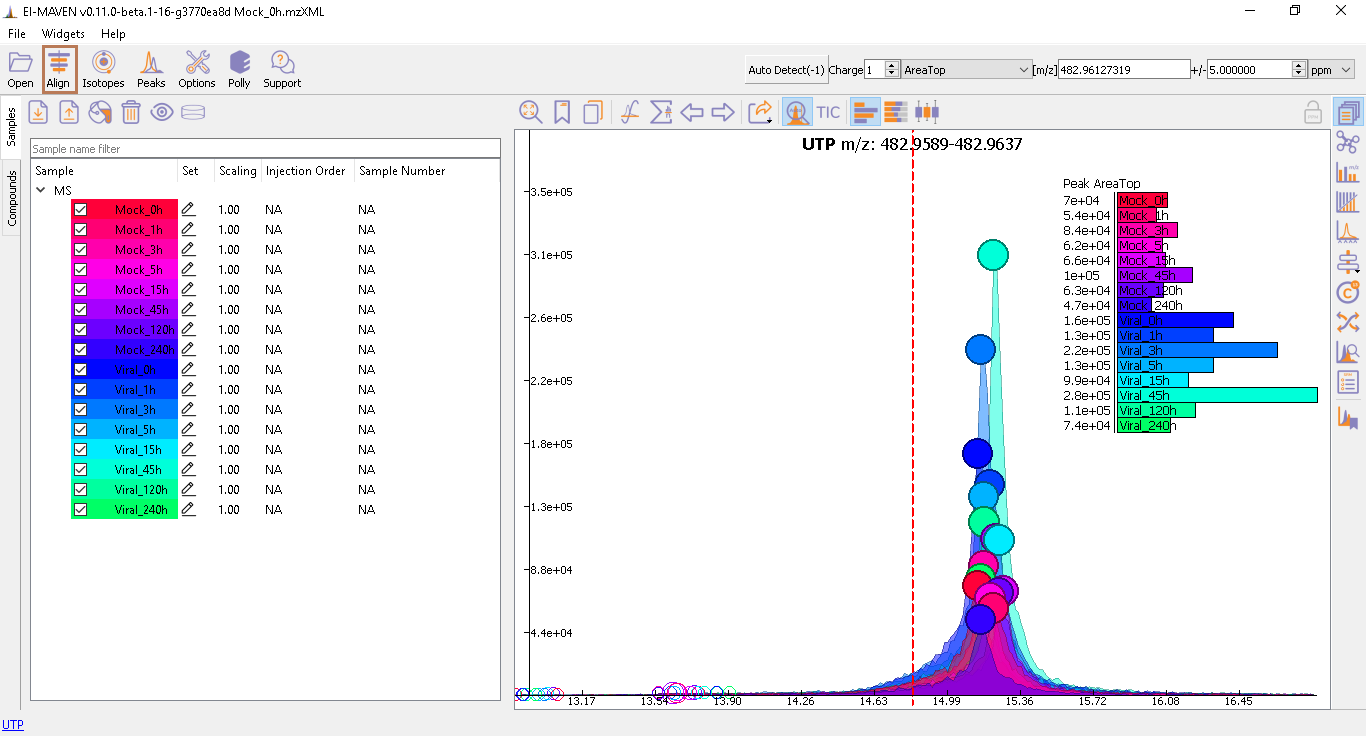
Prolonged use of the LC column can lead to a drift in retention time across samples. Alignment shifts the peak RTs in every sample to correct for this drift and brings the peaks closer to the median RT of the group. In case, the user finds the need to align some peak groups deviated from their RTs, they can set it right by selecting one of the two algorithms used to align the peak groups. A piece of detailed information on how each peak-alignment algorithm works can be found here. The pictures below show EIC of UTP before and after alignment, respectively. Post-alignment the peaks in the group should appear closer to the median RT of the group.

- Alignment visualization: Details on alignment visualization and its usage can be found here.
- Users can run alignment again with different parameters if required (or with a different algorithm). Further details on Alignment settings are available on the Widgets page.
Go to Options dialog and select the Peak Grouping tab. In case the data contains noise and the user wants to change the baseline by avoiding this noise, these parameters can be set according to the user. More details on it can be found on the Widgets page.
When measuring a number of peaks, it is often more effective to subtract an estimated baseline from the data. This baseline should be set where ideally no peaks occur. Although sometimes the program sets a particular baseline such that one or more peaks occur below that baseline value. In the following image, the dashed line represents each baseline:

The corresponding peaks are indicated with solid circles:

The baseline correction can be done in the Peak Detection tab by clicking on Options button:

Further details on settings can be accessed here.
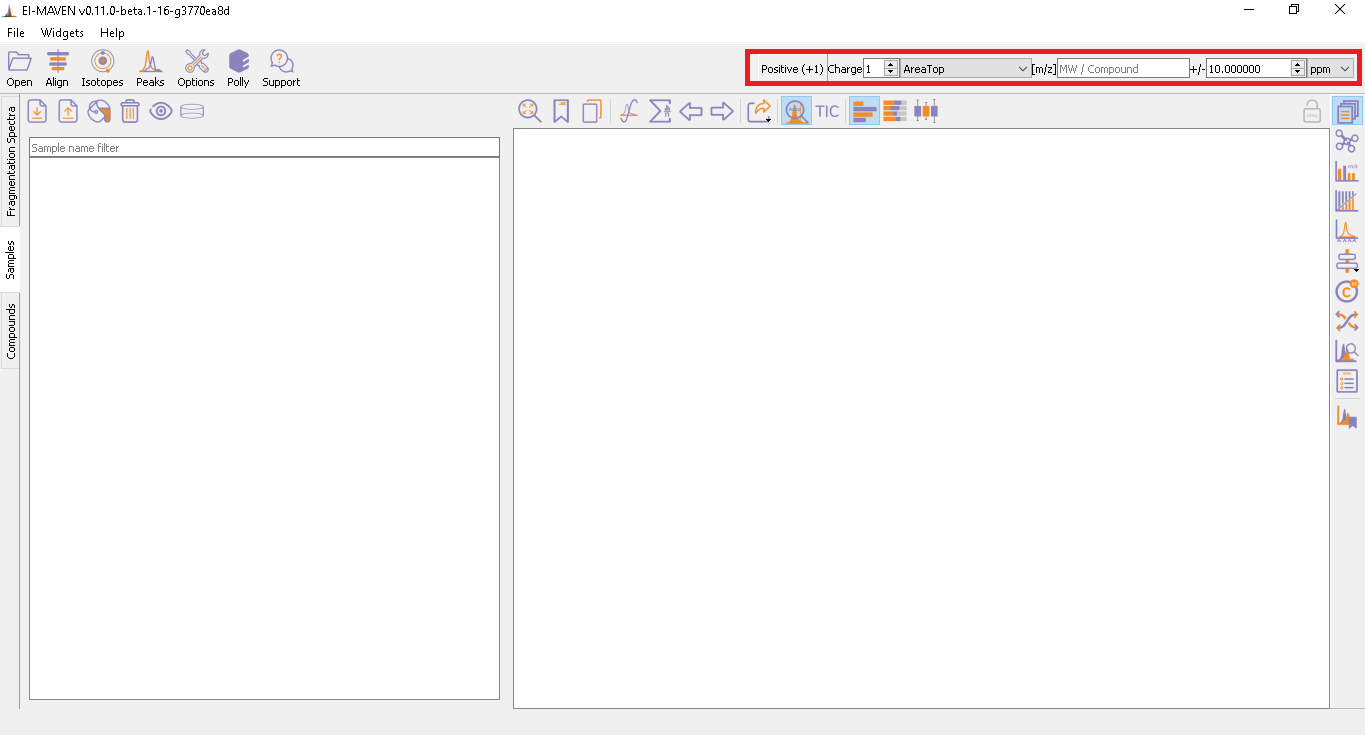
The user has an option to set Ionization mode to Positive, Negative or Neutral from the top left part of the screen. El-MAVEN auto-detects the polarity once the user uploads the raw mzML/mzXML files. The [m/z] option scans the groups to find any specific m/z value and plot its corresponding EIC. The _+/-_option to its right is to specify the expected mass resolution error in parts per million (ppm).
Mass Spectra Widget  displays each peak, its mass, and intensity for a scan. As the widget shows all detected masses in a scan, the ppm window for the EIC and consequently grouping can be adjusted accordingly. This feature is especially useful for MS/MS data and isotopic detection.

There are multiple ways to curate peaks in El-MAVEN. Users can follow these two broad workflows:
-
Manual Peak Curation using Compound DB widget
-
Automated Peak Curation
-
Manual Peak Curation using Compound DB widget
To use manual curation using the compound DB widget, the user has to iterate over all the compounds from the compound DB selected. Upon selecting a compound, El-MAVEN shows the highest-ranked group for that m/z. The user can now choose a group or reject it. There are two ways of doing this.
-
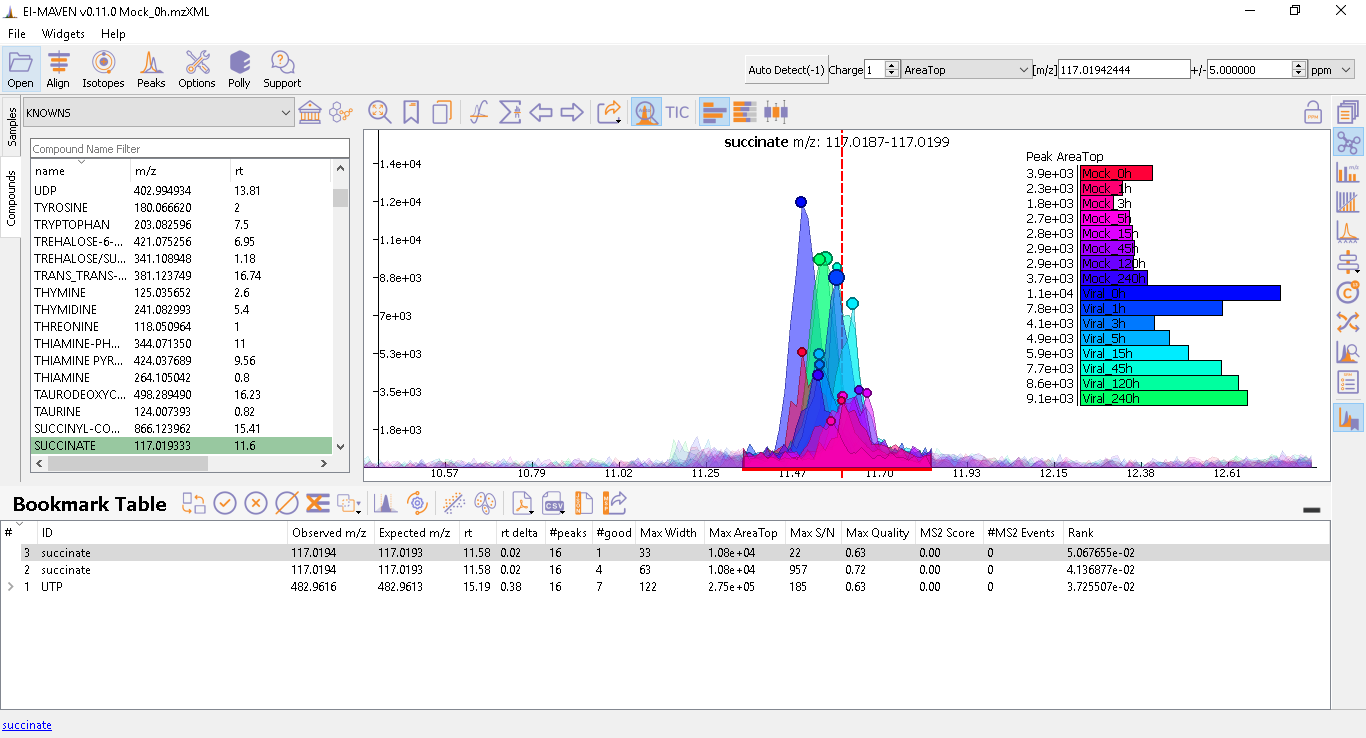
In the first workflow, the user needs to double-click or Shift_Drag on the peak group of interest after selecting the manual integration icon from the EIC widget toolbar
 . This will get the RT line to the median of the group and also add the metabolite to the bookmarks table (as shown in the image below). Users can read more about the bookmarks table here
 This peak group gets auto-saved and if the user wants to return to the original state of the peak-group or repeat the iteration, can go to History back option
  If the user tends to reiterate over an already bookmarked peak group, considering the different areas to be selected, a dialog pops up asking if the peak group of the same metabolite has to be added or not. If yes, then it names the bookmarked peak group with the metabolite name followed by a number.
-
The other sub-workflow is to mark peaks good or bad from the top of the EIC as shown in the screenshot below.

Qualifying peaks as good or bad is explained here.
- Automated Peak Curation
El-MAVEN can automatically select high intensity and high-quality groups. This workflow is called automatic peak curation. To enable this workflow the user has to click on the Peaks widget  present in the Main widget toolbar. Upon clicking the widget the user will see the following dialog box.
 The user can read more about it here.
For an Untargeted analysis, the user has to choose the Automated Feature Detection algorithm. Upon selecting the default parameters, the user can click on Find peaks to select the most important peaks. In case the user has a database to match against the sample peaks, one can enable the Identify using Database option.


Once the peak detection is completed, a peak table shows up at the bottom of the window containing 'features'. The format of these 'features' identified is 'm/z@rt'. If the Identify using Database option has been enabled, the peak table will contain both matched and unmatched features, as shown below.
 The user can now iterate over these peaks by marking them as good or bad by clicking on the 'Good' and 'Bad' buttons present in the peaks table as shown below.
If the detected peaks derived out of automated peak curation or manual integration need more iterations, the user can go to Peak Editor  widget on the Peak Table widget toolbar. More details on peak editor can be found here
-
There are multiple export options available for storing marked peak data. Users can either generate a PDF report to save the EIC for every metabolite, export data for a particular group in .csv format, or export the EICs to a JSON file as shown below.

-
Users can select All, Good, Bad, or Selected peaks to export.
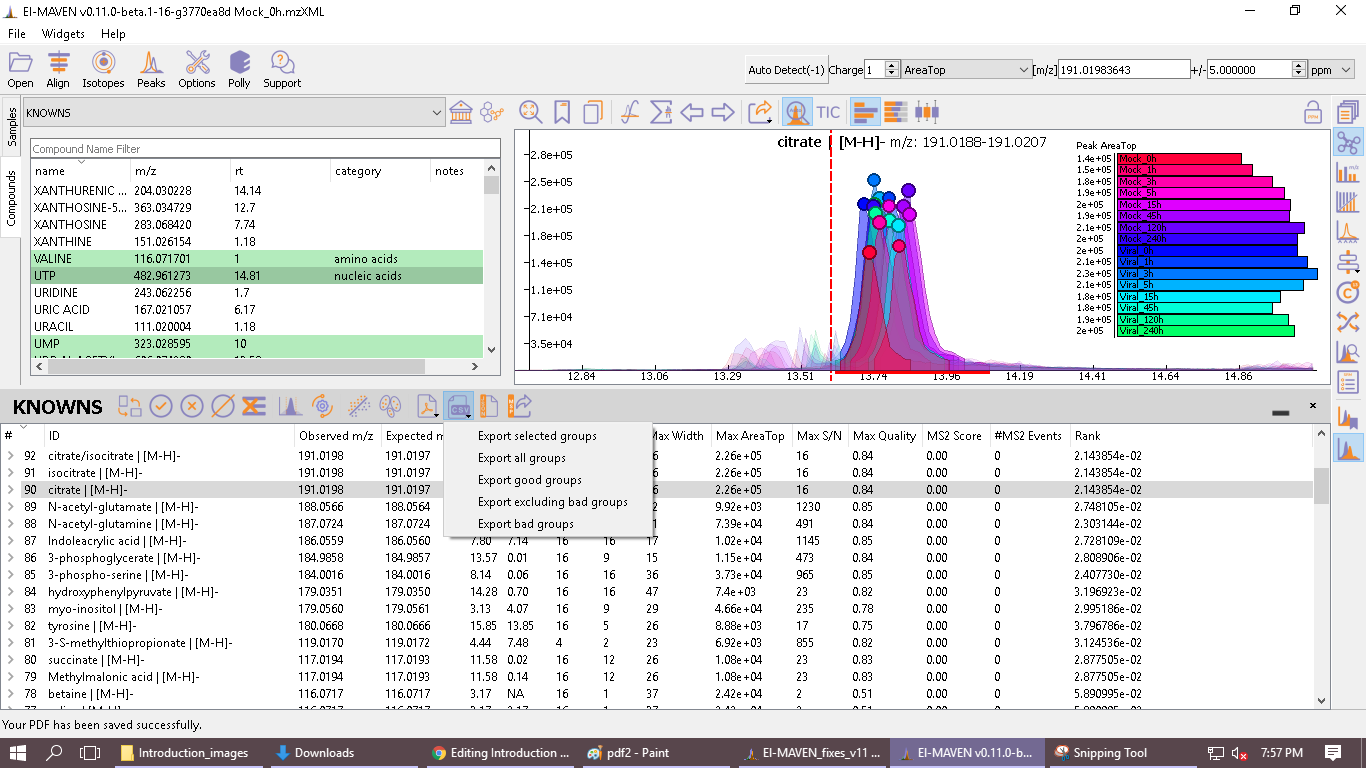
-
The Export Groups to CSV option
 lets the user save the 'good'/'bad' labels along with the peak table. The user also has the option to filter out rows that have a certain label while exporting the table.
 -
Generate PDF Report option
 saves all EICs with their corresponding bar plots in a PDF file.
 -
Export EICs to Json option
 exports all EICs in JSON file format.
 -
Another option is to export the peak data in .emDB format that can be directly loaded into El-MAVEN by clicking on the File menu. For this, go to the File option in the menu bar, and click on Save Project
 .
.