User manual Dashboard
The dashboard page is the application main page. This means that this page is âge is automatically presented to a freshly authenticated user.
On top of the Dashboard page, a summary bar with main information about the system status :
- current hosts status
- current services status
- current IT problems
- current impacts
The current hosts status shows how many hosts are currently monitored (and related to the current user) and which percentage of these hosts are currently UP. If percentage is lower than 90%, it displays on red background, if lower than 95% on orange background, else on green background.
Percentage thresholds are defined in the Web UI configuration file.
The current services status shows how many services are currently monitored (and related to the current user) and which percentage of these services are currently OK. If percentage is lower than 90%, it displays on red background, if lower than 95% on orange background, else on green background.
Percentage thresholds are defined in the Web UI configuration file.
The current IT problems shows how many problems are currently detected (and related to the current user). If the worst problem is critical it displays on red background, if warning than on orange background, else on green background if no problems are detected.
The current impacts shows how many impacts are currently present (and related to the current user). If the worst impact is critical it displays on red background, if warning than on orange background, else on green background if no impacts are present.
The page layout is made of a three-columns grid that displays some widgets. Widgets may be chosen by the logged in user. The chosen widgets and their configuration is part of the user's preferences and will be stored if a storage module is configured.
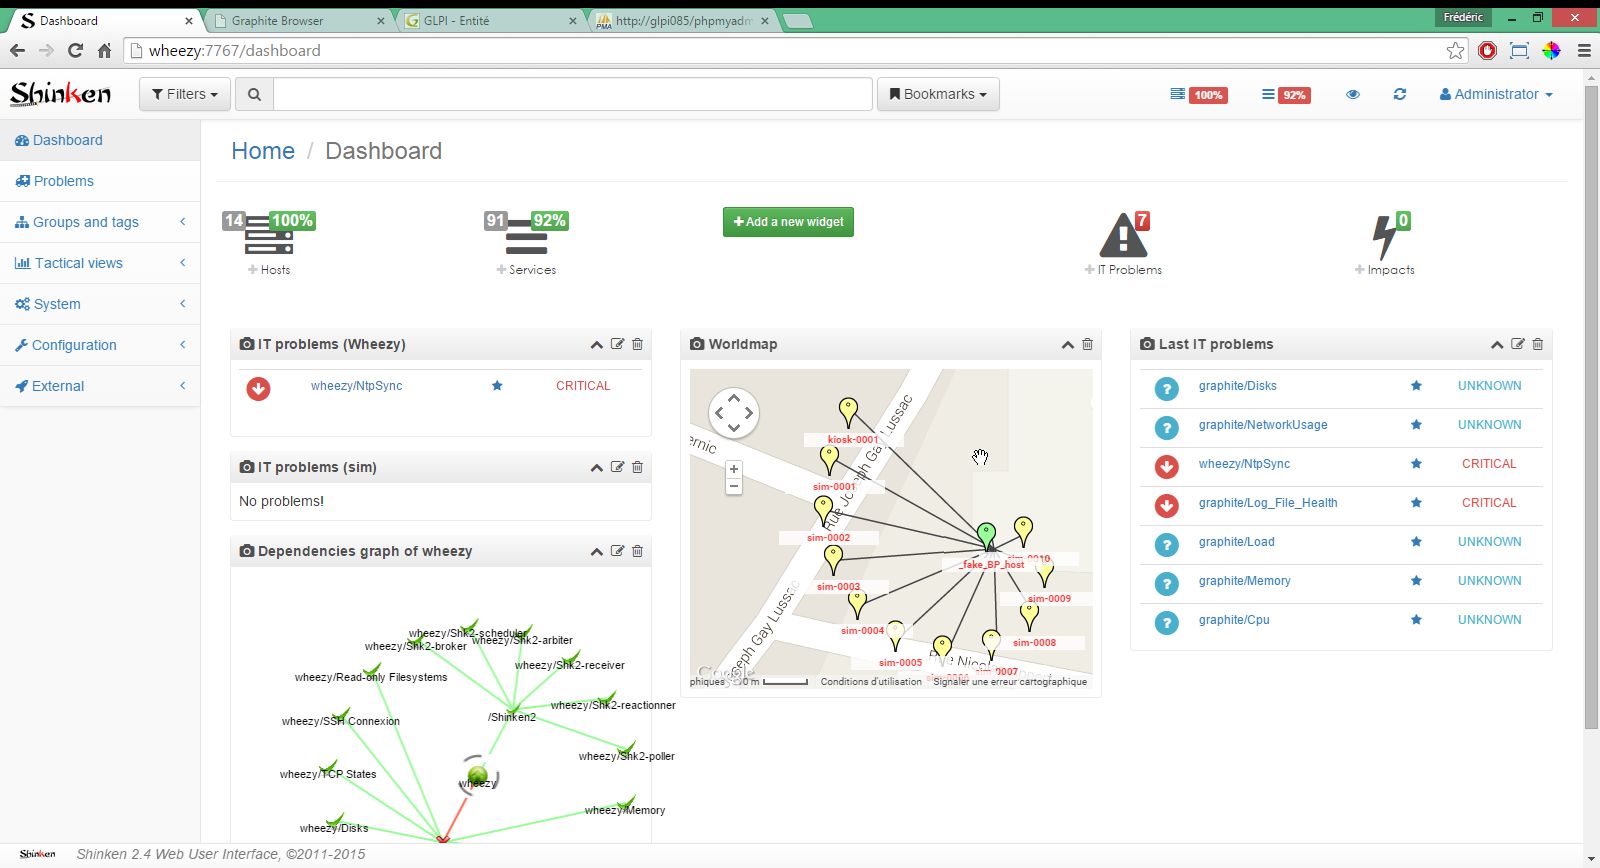
To add a widget on the dashboard page, click on "Add a new widget" and then choose the desired widget. Some widgets may be configured if the widget top bar contain an edit icon. Widgets are collapsible when clicking on the up arrow in the top. They may be removed when clicking on the trash bin in the top bar.
In the navigation bar, the eye icon enables to switch to this view that is a fullscreen display of the main information concerning the overall system status.
Keep an eye on your monitored infrastructure with this view ...
The top area contains a line for all possible hosts states and a line for all possible services states. Each possible state displays the number and percentage of concerned hsots/services.
The middle area also contains a line for all possible hosts states and a line for all possible services states. Each possible state displays the number/total and percentage of concerned hosts/services. If percentage is lower than 90%, it displays on red background, if lower than 95% on orange background, else on green background.
Percentage thresholds are defined in the Web UI configuration file.
The bottom area displays the current IT problems and the current impacts. For IT problems, number of hosts problems and services problems are displayed on a background color indicating the worst state.
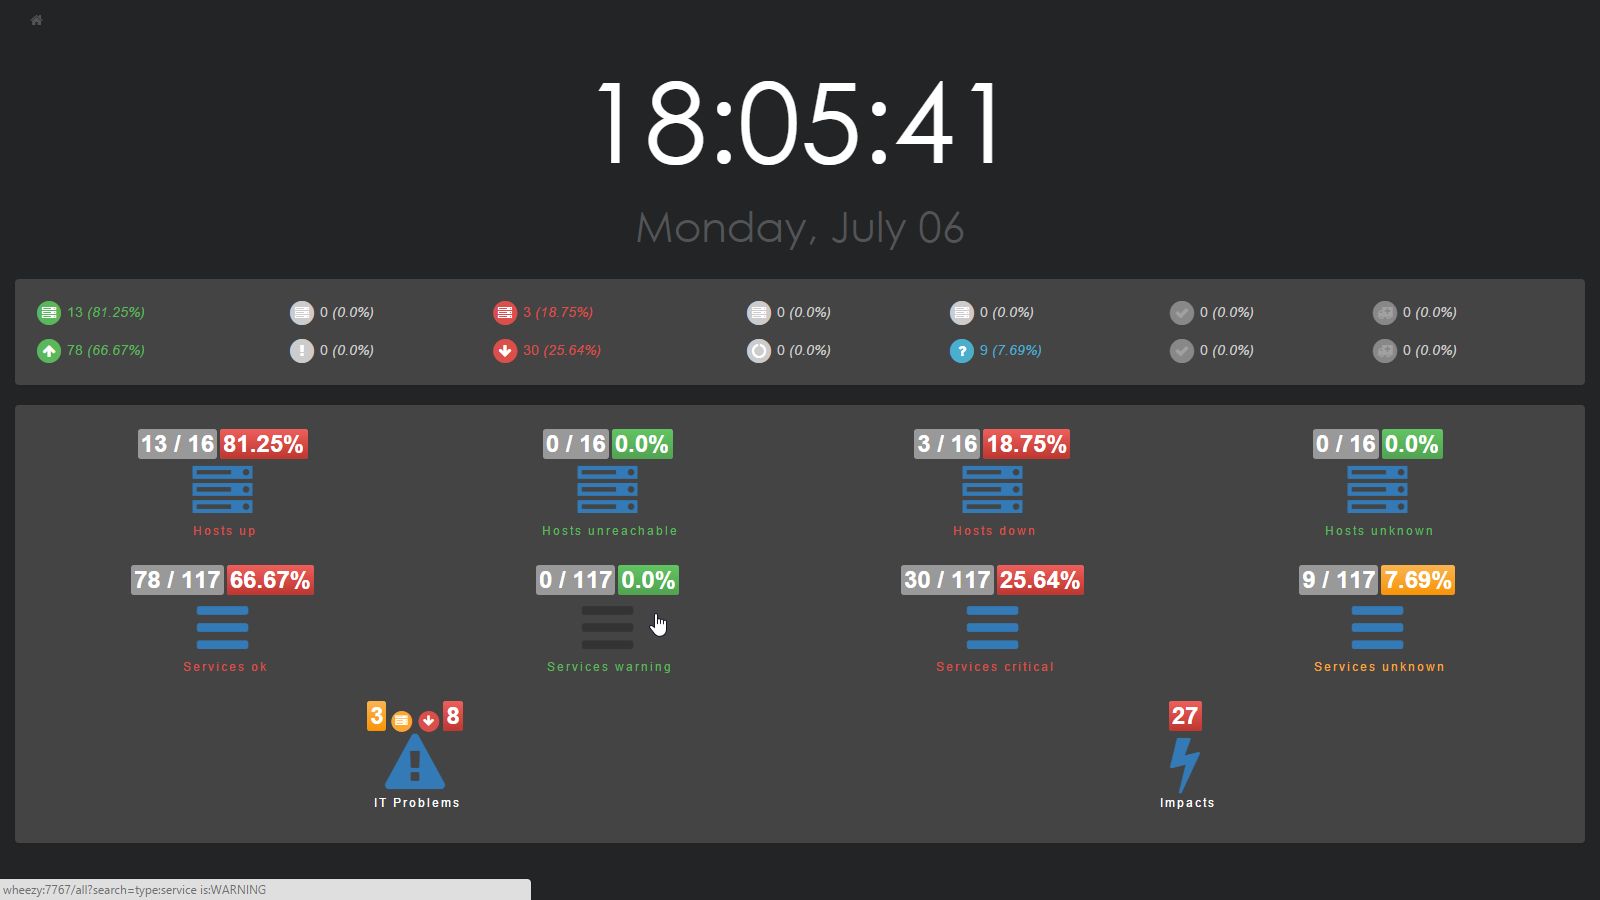
An icon on top left of this view allows to go back to Dashboard page. Another icon allows to switch to toggle browser to fullscreen mode (if your browser support this feature ...).
This documentation part is to be developed ...
Displays the map of the current hosts.
Displays the more important impacts. Number of displayed element is configurable.
Displays the more important problems. Configured with an host, the problems are filtered for this host.
Displays the more recent problems. Number of displayed element is configurable.
Configured with an host, it displays the dependency graph of this host.
Configured with an host, it displays the host check metrics graph of this host.
![]() - Shinken Web User Interface, version 2.1+, ©2011-2016
- Shinken Web User Interface, version 2.1+, ©2011-2016