-
Notifications
You must be signed in to change notification settings - Fork 3
HGS example
In this example we show how to prepare the Ichnos input files from a HydroGeoSphere simulation. We should note that HGS is capable to simulate integrated surface - groundwater systems but Ichnos can trace particles only within the groundwater domain.
The example of this tutorial is described in detailed by Yu et al., 2016.
Many thanks to Prof. Yu who provided the output simulation files
The domain of this example is rectangular as shown in the following figure

The tecplot formatted output of the HGS simulation provides information about the mesh and the domain. However, in this example the domain is rectangular with dimensions 1x1 km so we can create the required file in a simple way
fid = fopen('hgs_test_domain.ich','w');
fprintf(fid,'%d %d\n', [4 1]);
fprintf(fid, '%.2f %.2f\n',[0 0; 1000 0; 1000 1000; 0 1000]');
fclose(fid);
More info on domain outline can be found here.
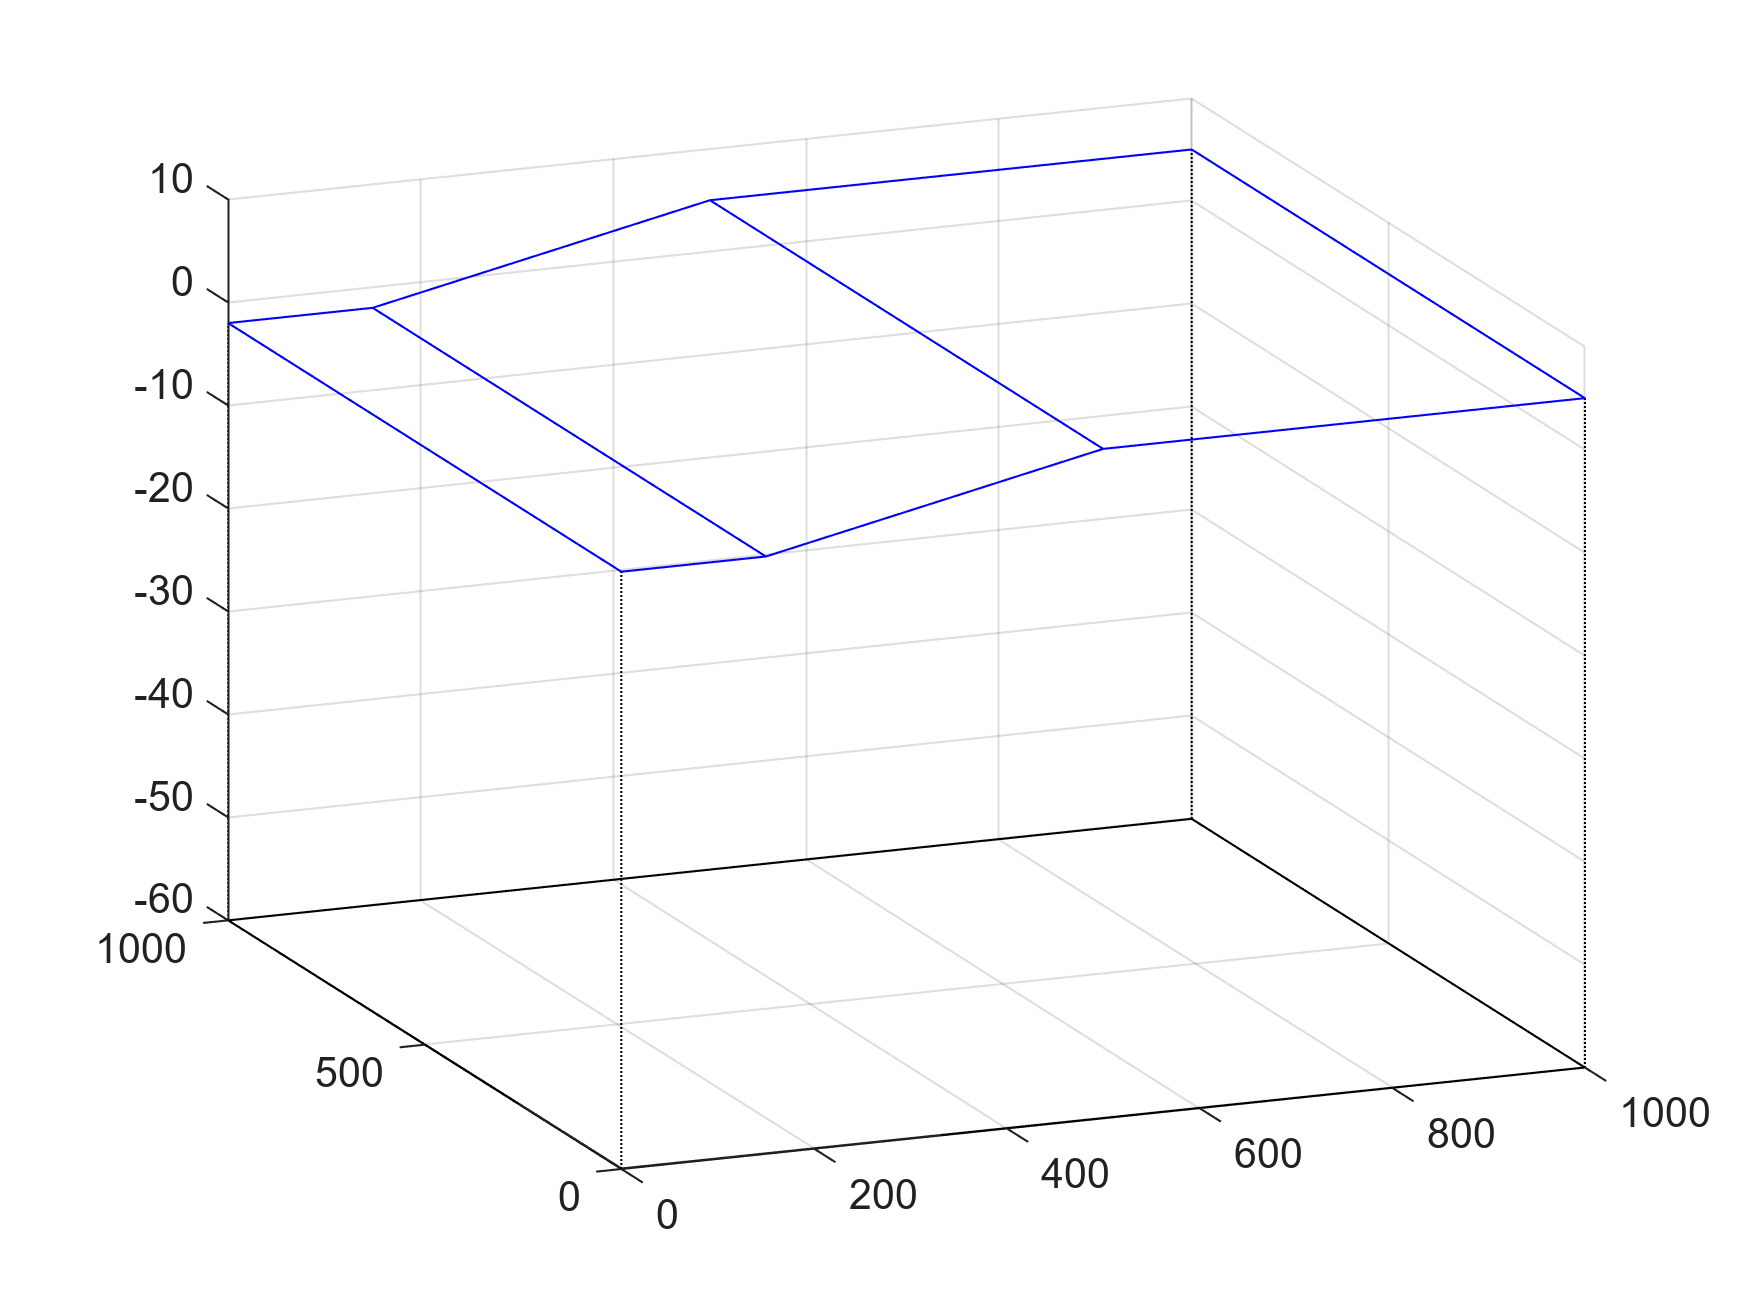
For the top we will create a mesh with three quadrilateral elements:
top_nodes = [0 0 -2; 150 0 -2; 500 0 5; 1000 0 5];
top_nodes = [top_nodes; top_nodes + [zeros(4,1) 1000*ones(4,1) zeros(4,1)]];
top_msh = [1 2 6 5; 2 3 7 6; 3 4 8 7];
Then we can print the top function as MESH2D option
fid = fopen('hgs_test_top.ich','w');
fprintf(fid,'MESH2D\n');
fprintf(fid, '%d %d %.2f\n', [size(top_nodes,1), size(top_msh,1) 1000]);
fprintf(fid, '%.2f %.2f %.2f\n', top_nodes');
fprintf(fid, '%d %d %d %d\n', top_msh');
fclose(fid);
The HGS is a full 3D finite element model and in this particular example the velocity is defined at the center of the elements. Therefore, we can use the MESH2D support structure, which is used to trace particles in meshes that are extruded into multiple layers in the one direction.
The output of the HGS for this example is a tecplot file with all the info (nodes, meshes velocities and more) written into a single file. To the best of my knowledge I have not found any matlab package to process a tecplot output. So here we read the required data in a kind of manual manner.
First we bring the entire file into matlab and break it into lines
str = fileread('ow_3do.dat');
lines = regexp(str, '\r\n|\r|\n', 'split')';
Next we manually identified the starting and ending lines of the nodes, elements and velocities and read them:
- Node Coordinates
X = [];
for ii = 5:63251
    X = [X; str2double(strsplit(strtrim(lines{ii,1})))'];
end
Y = [];
for ii = 63253:126499
    Y = [Y; str2double(strsplit(strtrim(lines{ii,1})))'];
end
Z = [];
for ii = 126501:189747
    Z = [Z; str2double(strsplit(strtrim(lines{ii,1})))'];
end
- Linear velocities
vx = [];
for ii = 376246:436245
    vx = [vx; str2double(strsplit(strtrim(lines{ii,1})))'];
end
vy = [];
for ii = 436247:496246
    vy = [vy; str2double(strsplit(strtrim(lines{ii,1})))'];
end
vz = [];
for ii = 496248:556247
    vz = [vz; str2double(strsplit(strtrim(lines{ii,1})))'];
end
- Elements
msh3D = [];
for ii = 799500:1099499
    msh3D = [msh3D; str2double(strsplit(strtrim(lines{ii,1})))];
end
Now we can print the required files for an Element velocity type
- Node file see also Note that we print only the x and y coordinates of the nodes
fid = fopen('hgs_test_nodes.ich','w');
fprintf(fid,'%.2f %.2f\n', [X(1:10201) Y(1:10201)]');
fclose(fid);
- Mesh file see also This prints only the 2D mesh
fid = fopen('hgs_test_msh.ich','w');
fprintf(fid,'%d %d %d %d %d\n', [msh3D(1:10000,1:4) zeros(10000,1)]');
fclose(fid);
- Elevation file see also
Elev = fliplr(reshape(Z,10201,31));
fid = fopen('hgs_test_elev.ich','w');
fprintf(fid, ['%.5f' repmat(' %.5f',1,30) '\n'], Elev');
fclose(fid);
- Velocity see also
VX = fliplr(reshape(vx, 10000,30));
VY = fliplr(reshape(vy, 10000,30));
VZ = fliplr(reshape(vz, 10000,30));
DATA = [reshape(VX,300000,1) reshape(VY,300000,1) reshape(VZ,300000,1)];
mult = 1000000;
fid = fopen('hgs_test_vel_SS_000.ich','w');
fprintf(fid, '%.6e %.6e %.6e\n', mult*DATA');
fclose(fid);
Examples of the main and velocity configuration files are provided in the links.
Yu, X., J. Yang, T. Graf, M. Koneshloo, M. A. O'Neal, and H. A. Michael (2016), Impact of topography on groundwater salinization due to ocean surge inundation, Water Resour. Res., 52, 5794–5812, doi:10.1002/2016WR018814.