How to use the debugging tool
The idea behind the debugging tool is to provide an easy way to manipulate and view the properties of the renderers/renderables used in a JPlotter application.
The debugger should be both easy to use and extendable for possibly new or modified renderers/renderables.
How this goal is achieved will be described later on.
Here is a short example on how to use the debugging tool in JPlotter.
It can be used in any chart, as it just needs its underlying canvas object:
// instantiating the debugger
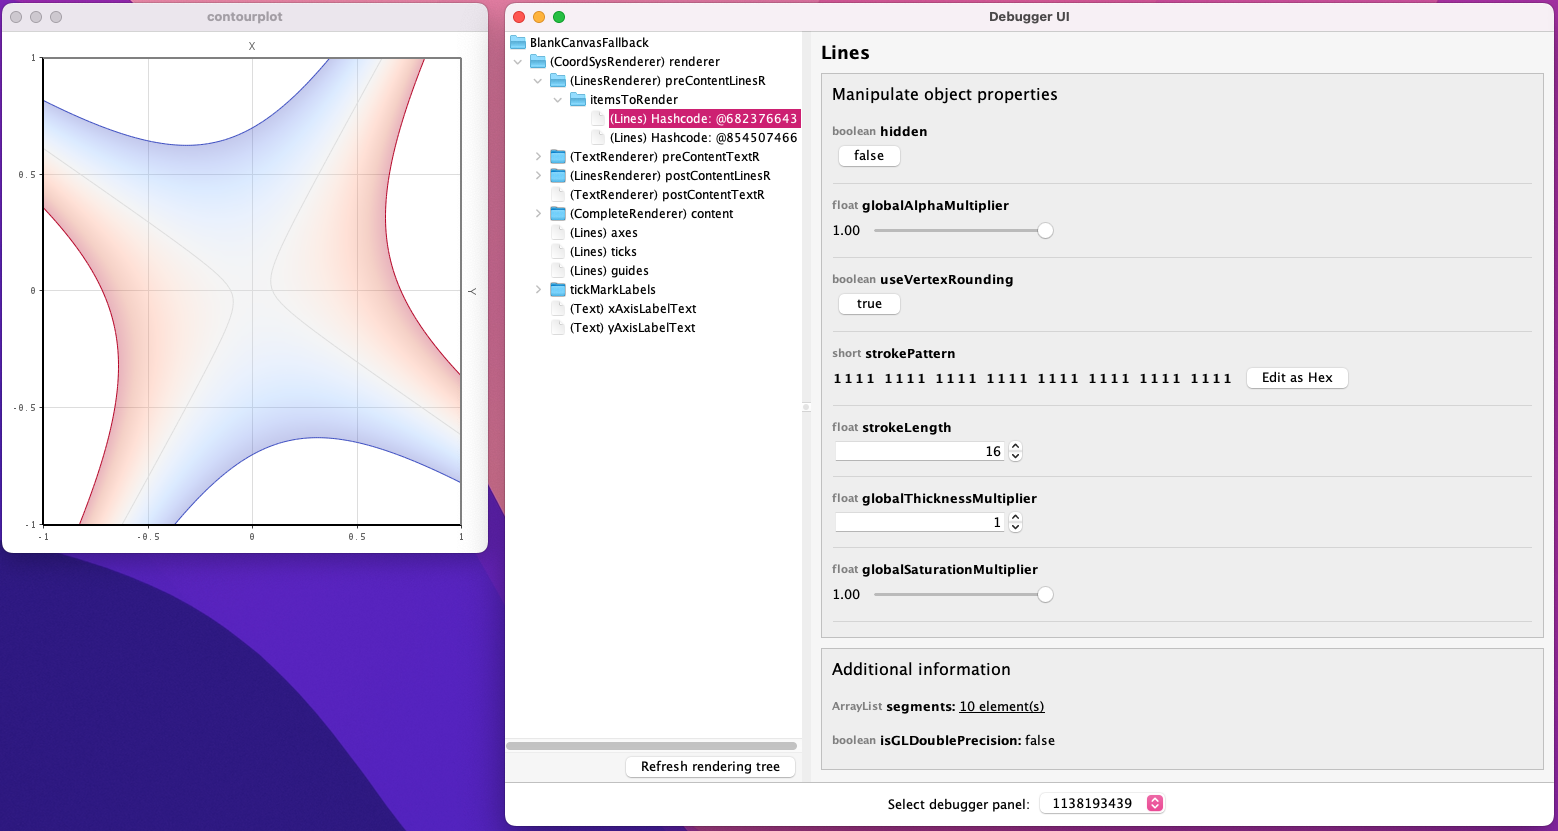
DebuggerUI debugger = new DebuggerUI(canvas);In the case of the image above the usage of the debugger looks like this (ContourPlot.java):
// generate or get data
double[][] dataA = randomData(50);
double[][] dataB = randomData(100);
// create Points objects that display as filled circles and crosses
Points pointsA = new Points(DefaultGlyph.CIRCLE_F);
Points pointsB = new Points(DefaultGlyph.CROSS);
// add the individual coordinates as points
for(double[] entry: dataA){
	double x=entry[0], y=entry[1], heat=entry[2];
	PointDetails point = pointsA.addPoint(x,y);
	// set point's color
	int argb = DefaultColorMap.D_COOL_WARM.interpolate(heat);
	point.setColor(argb);
}
for(double[] entry: dataB){
	pointsB.addPoint(entry[0],entry[1]).setColor(Color.GRAY);
}
// use a coordinate system for display
CoordSysRenderer coordsys = new CoordSysRenderer();
coordsys.setCoordinateView(-1,-1,1,1);
// set the content renderer of the coordinate system
// we want to render Points objects
PointsRenderer content = new PointsRenderer();
content.addItemToRender(pointsB).addItemToRender(pointsA);
coordsys.setContent(content);

// display within a JFrame
JFrame frame = new JFrame();
boolean useOpenGL = false;
JPlotterCanvas canvas = useOpenGL ? new BlankCanvas() : new BlankCanvasFallback();
canvas.setRenderer(coordsys);
canvas.asComponent().setPreferredSize(new Dimension(400, 400));
canvas.asComponent().setBackground(Color.WHITE);
frame.getContentPane().add(canvas.asComponent());
frame.setTitle("scatterplot");
frame.setDefaultCloseOperation(JFrame.EXIT_ON_CLOSE);
canvas.addCleanupOnWindowClosingListener(frame);
// make visible on AWT event dispatch thread
SwingUtilities.invokeLater(()->{
	frame.pack();
	frame.setVisible(true);
});

long t=System.currentTimeMillis()+2000;
while(t>System.currentTimeMillis());
if("false".equals("true"))
SwingUtilities.invokeLater(()->{
	Img img = new Img(frame.getSize());
	img.paint(g2d->frame.paintAll(g2d));
	ImageSaver.saveImage(img.getRemoteBufferedImage(), "scatterplot.png");
});

// instantiating the debugger (this is the interesting part)
DebuggerUI debugger = new DebuggerUI(canvas);The debugger also supports handling multiple canvases in one window. Therefore, an array containing the canvases has to be passed to the DebuggerUIs' constructor.
DebuggerUI debuggerUI = new DebuggerUI(canvasCollection.toArray(new JPlotterCanvas[0]));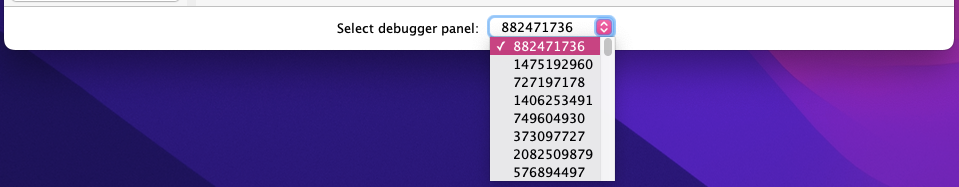
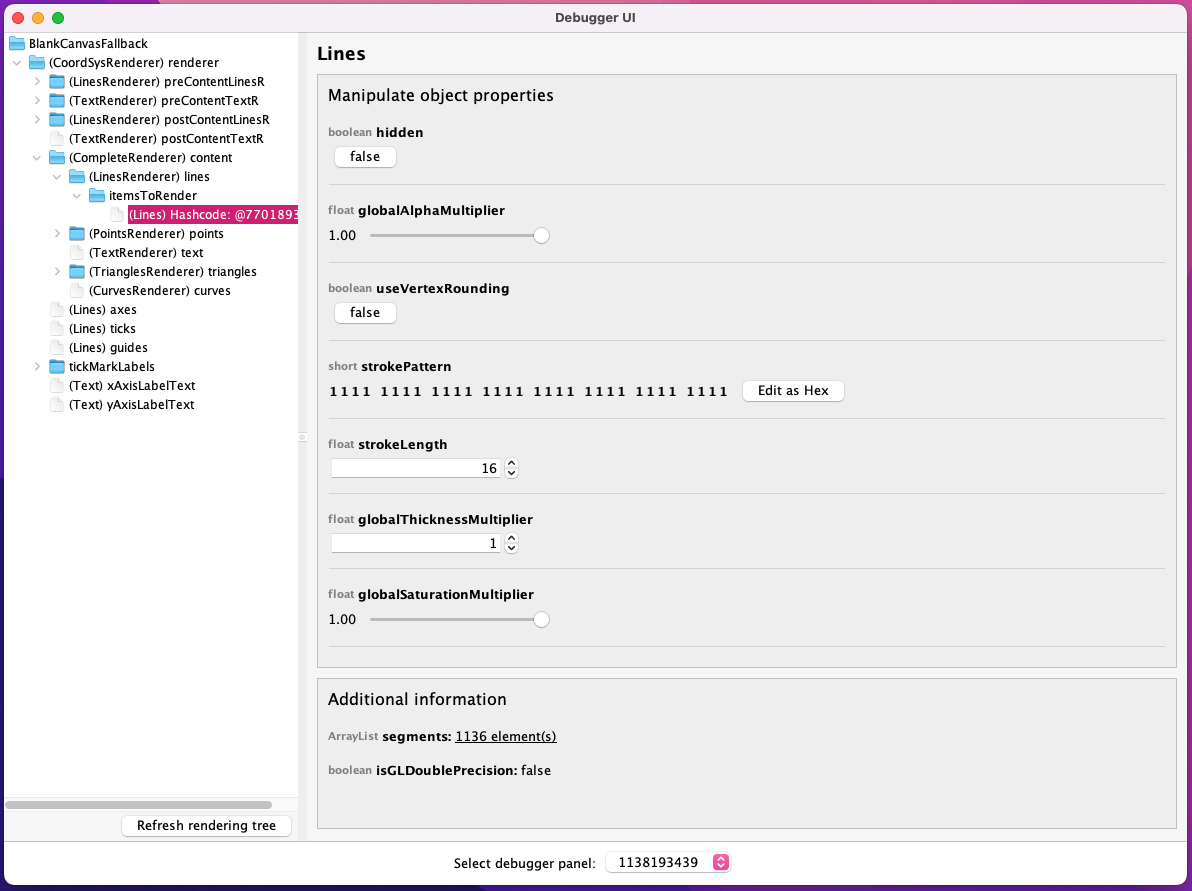
The debuggers window is basically split into two sections. The tree menu on the left, and the "manipulation" area on the right.
The section on the right will be updated when a new renderer/renderable is selected, where its properties can then be manipulated.
There's also a "additional information" section at the bottom where properties are displayed that can't be manipulated in a useful way.
Global actions, like exporting the canvas, can be found in the tab of the canvas (e.g., BlankCanvasFallback in the screenshot).
See more information about the technical background in the corresponding issue #35.
There it is also described how to extend the debugger so it takes additional properties into account.