Interaction
JPlotter offers an API to navigate the coordinate system.
The API is offered by the CoordSysPanning class. It allows to pan the coordinate system by dragging the mouse while holding the left mouse button.
This can be done by creating a new instance of the class and registering it to a canvas, as shown in the example below:
JPlotterCanvas canvas = new BlankCanvas();
CoordSysRenderer coordsys = new CoordSysRenderer();
CoordSysPanning csp = new CoordSysPanning(canvas, coordsys).register();
By default the control key needs to be pressed to enable panning, but this can be changed by passing a different modifier mask to the constructor, (e.g. new CoordSysPanning(canvas, coordsys){{extModifierMask=0;}}.register();, which would disable the need to press any key to enable panning).
The panned axes can be changed by calling the setPannedAxes() method of the CoordSysPanning class (1 for the x-axis, 2 for the y-axis).
csp.setPannedAxes(1);
JPlotter offers an API to zoom into the coordinate system.
The API is offered by the CoordSysScrollZoom class. It allows to zoom into the coordinate system by scrolling the mouse wheel.
This can be done by creating a new instance of the class and registering it to a canvas, as shown in the example below:
JPlotterCanvas canvas = new BlankCanvas();
CoordSysRenderer coordsys = new CoordSysRenderer();
CoordSysScrollZoom csz = new CoordSysScrollZoom(canvas, coordsys).register();
The zoom factor of the zooming can be changed by calling the setZoomFactor() method of the CoordSysScrollZoom class.
csz.setZoomFactor(1.5);The CoordSysScrollZoom class also offers the option to only zoom into a specific axis of the coordinate system (1 for the x-axis, 2 for the y-axis).
csz.setZoomedAxes(1);
JPlotter offers an API to select a rectangular portion of the coordinate system.
The API is offered by the CoordSysViewSelector class.
One possible use of this API is to zoom into the selected area, as shown in the GIF below.
The corresponding code is shown below:
JPlotterCanvas canvas = new BlankCanvas();
CoordSysRenderer coordsys = new CoordSysRenderer();
new CoordSysViewSelector(canvas, coordsys) {
	public void areaSelected(double minX, double minY, double maxX, double maxY) {
    	coordsys.setCoordinateView(minX, minY, maxX, maxY);
	}
}.register();
However, the helper class CoordSysRectangleZoom has been implemented to make this use case easier.
The interaction APIs are currently being reworked to allow more flexible key masks.
The new API will be based on the KeyMaskListener interface, which will allow to register listeners for key masks.
Once those enhancements are finished, the current API will be deprecated and the wiki will be updated.
To select renderables (e.g. points) in a coordinate system, the PickingRegistry class (as described in the Picking section of the Wiki) has to be used.
One example of how to use the PickingRegistry class to highlight renderables is shown below:
LinesRenderer lineContent = new LinesRenderer();
PickingRegistry<Lines> picking = new PickingRegistry<>();

Lines line = new Lines();
line.addSegment(0, 0, 1, 1).setColor(defaultLineColor);
lineContent.addItemToRender(line.setGlobalAlphaMultiplier(0.5));
int pickid = picking.register(line);
line.getSegments().forEach(seg->seg.setPickColor(pickid));

CoordSysRenderer coordsys = new CoordSysRenderer();
coordsys.setContent(lineContent);

canvas.asComponent().addMouseListener(new MouseAdapter() {
	public void mouseClicked(MouseEvent e) {
		// make all lines grey
		lineContent.getItemsToRender().forEach(l -> l.getSegments().forEach(s->s.setColor(defaultLineColor)));
		canvas.scheduleRepaint();
		// get picked obj
		int id = canvas.getPixel(e.getX(), e.getY(), true, 3);
		Lines lines = picking.lookup(id);
		if(lines==null)
			return;
		// highlight
		lines.getSegments().forEach(s->s.setColor(Color.RED));
		// bring to front
		lineContent.removeItemToRender(lines);
		lineContent.addItemToRender(lines);
		canvas.scheduleRepaint();
	};
});
The code above will color the line segment that was clicked on with a red color.
The CoordSysViewSelector class can also be used to select renderables via a rectangle selection.
One example of how to use the CoordSysViewSelector class to select renderables is shown below.
In this case the CoordSysViewSelector class is used to select points in a scatterplot. This can be used for other renderables too.
// This is the setup of a simple scatterplot
int numPointSamples = 400;
double[] pointsX = new double[numPointSamples];
double[] pointsY = new double[numPointSamples];
for(int i=0; i<numPointSamples; i++){
	double x = Math.random()*2-1;
	double y = Math.random()*2-1;
	pointsX[i]=x;  pointsY[i]=y;
}

Points scatterPoints = new Points(DefaultGlyph.CROSS);
for(int i=0; i<numPointSamples; i++){
	scatterPoints.addPoint(pointsX[i], pointsY[i]).setColor(Color.BLUE.getRGB());
}

CoordSysRenderer coordsys = new CoordSysRenderer();
CompleteRenderer content = new CompleteRenderer();
coordsys.setContent(content.addItemToRender(scatterPoints));

JPlotterCanvas canvas = new BlankCanvas();
canvas.setRenderer(coordsys);

// Here the point selection is happening
new CoordSysViewSelector(canvas,coordsys, new KeyMaskListener(0)) {
	@Override
	public void areaSelected(double minX, double minY, double maxX, double maxY) {
		Rectangle2D area = new Rectangle2D.Double(minX, minY, maxX-minX, maxY-minY)
		// find intersecting points with getIntersectingPoints(Rectangle2D)
		List<Points.PointDetails> intersectingPoints = scatterPoints.getIntersectingPoints(area);
		for (Points.PointDetails point : intersectingPoints) {
			point.setColor(Color.RED);
		}
		canvas.scheduleRepaint();
	}
}.register();Similarly a selection via rope selection can be done. The main difference being that
// The setup of the scatterplot is the same as above.
// ...
// Here the point selection via rope selection is happening
// Highlighted points are colored in red
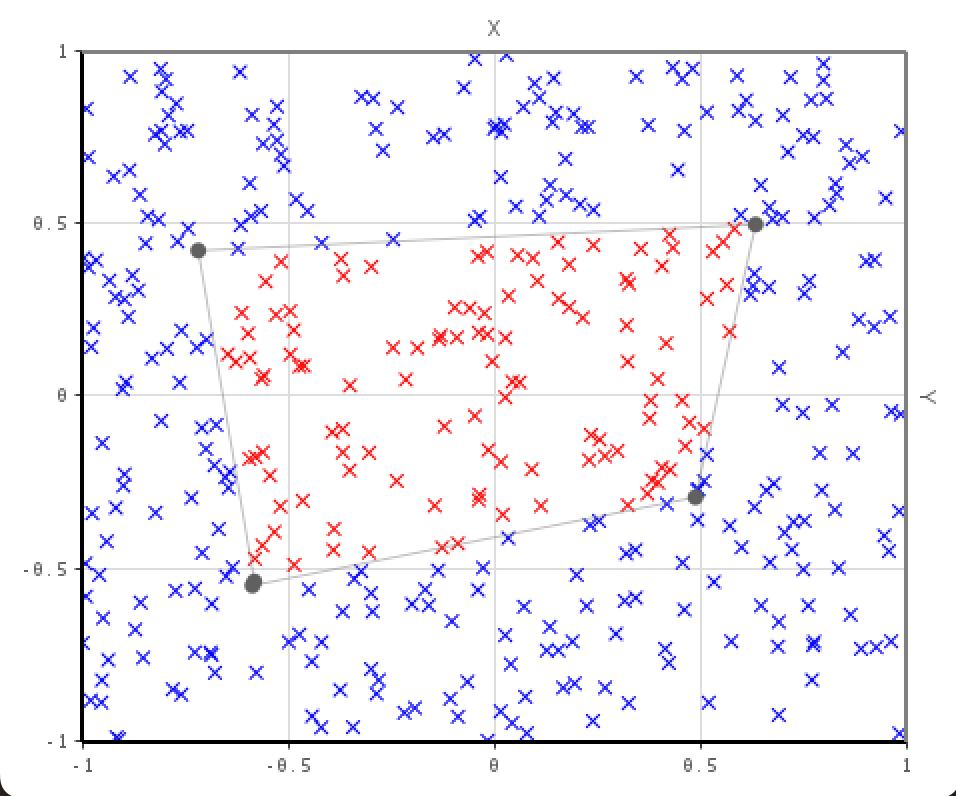
new CoordSysRopeSelection(canvas,coordsys, new KeyMaskListener()) {
@Override
public void areaSelected(Path2D selectedArea) {
for (Points.PointDetails point: scatterPoints.getPointDetails()) {
if (selectedArea.contains(point.location)) {
point.setColor(Color.RED);
}
}
canvas.scheduleRepaint();
}
}.register();A possible application of the rope selection is shown below: