-
Notifications
You must be signed in to change notification settings - Fork 13
Search
Feature Search enables searching for Features, which may be Markers in genetic maps, or genes in an annotation of a reference assembly, or QTLs. This section covers search by feature name.
The names to search for may be copy/pasted from an external data source such as a spreadsheet or a paper, or copied from features selected in a dataset within Pretzel. These 2 cases will be described here. Each case will be described for Markers and Genes separately for clarity; the operation is essentially the same.
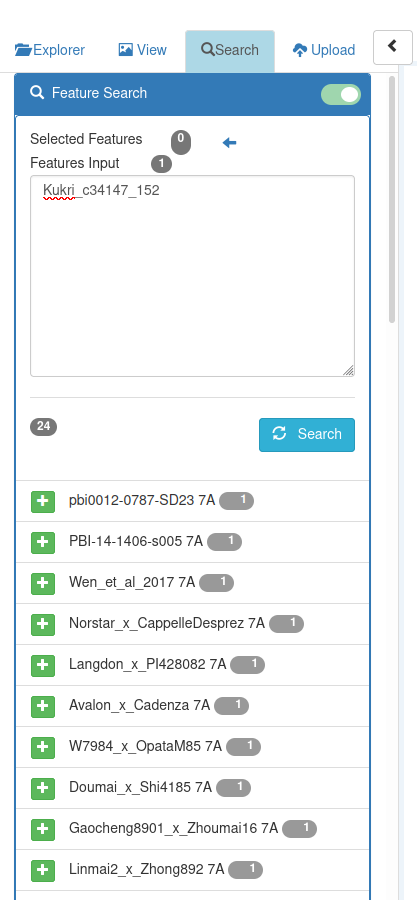
Click on Search in the left panel, which shows the 'Feature Search' component :

Input the names of the markers you wish to search for in the 'Features Input' field.
Clicking on 'Search' will display a list of the chromosomes (Blocks) of Datasets which contain a Feature with a name in the search input text :

The number of matching features of each matched Block is shown. The Blocks are sorted with those with the most matches at the top (i.e. in descending order by this count)
For further detail, see Feature Search Results.
The search result will also highlight the matching Features in the graph with a triangle

By clicking on the  button, the chosen blocks will be added to the graph view, and their matching features will be highlighted with triangles.

After clicking on the  button, it will not be shown for that Block.

Zooming in on both axes near the matched features will clarify the relationship between the genetic maps in the vicinity of those markers.

As you zoom in, additional alignment paths are requested from the server to maintain a consistent level of detail in the display. (The level of detail is adjustable, controlled by View : Paths : Sample.)
To see the relationship to the reference assembly for those markers, locate in the feature search result the dataset which aligns the markers to the reference assembly:

and add it :

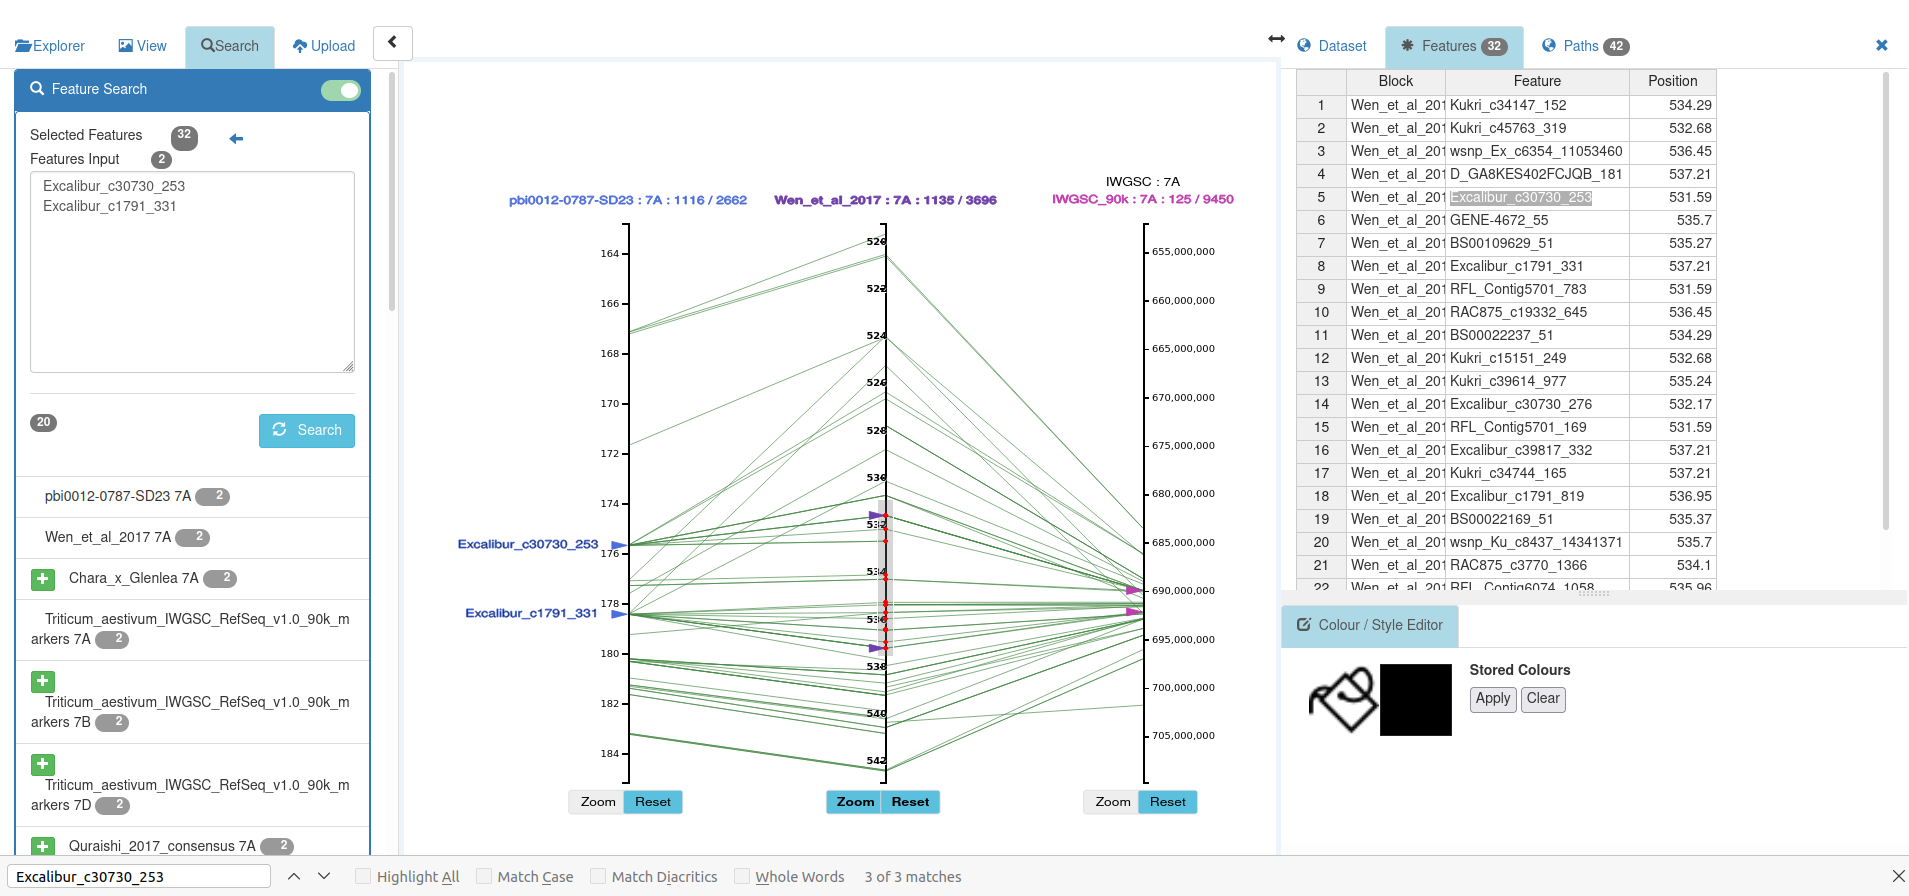
To get the position information on the reference assembly, brush the axis showing the reference assembly (in this case IWGSC). This displays the reference position of the brushed markers in the features table. Use the browser find text command (e.g. Ctrl-F, or Cmd-F on Mac) and paste in the name of one of the markers; this will find the text in the features results and in the features table; step down to the 2nd match which is in the features table :

It is also possible to locate the marker in the features table by clicking on the Feature column header which will sort the table on the Feature name values, and scrolling to see the marker.
For the 2nd marker, use the same process : Ctrl-F to do a text search of the Features Table :

You can copy/paste the location values from the Features Table by selecting the row or the Position / End columns, and Ctrl-C (or Cmd-C on Mac).
To identify the feature search result highlight triangles, click on them, and the feature name will be shown as a label :

Similarly, to identify the position of the matched markers on the genetic map, brush on the genetic map to select the markers; this will display the markers and their positions in the Feature Table.

Similarly for the 2nd marker name :

To identify a gene associated with a marker, use the reference axis (IWGSC 7A in this example). Add the HC_gene dataset for 7A :
Use the dataset explorer search filter to narrow the display to the IWGSC datasets, and click the Genome tab to see them grouped under the reference :

Within the reference, scroll down to the Chromosome of interest (7A in this case), and click on
 to expand it, listing all datasets on that Chromosome for that reference :

Click on the  button for the HC genes dataset :

This adds this dataset to the IWGSC 7A axis.
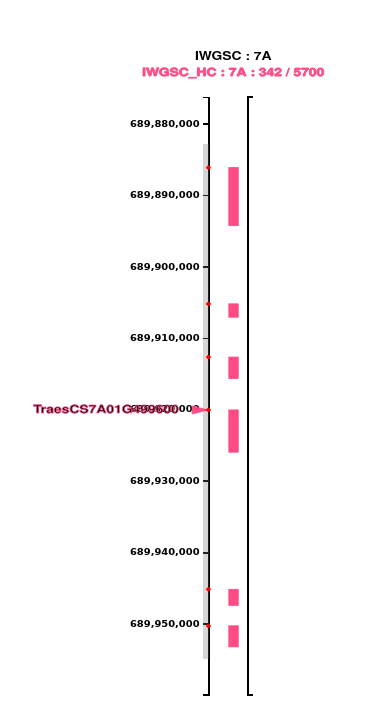
Split the axis to display the gene track; zoom in and brush around the marker; click on the rectangle in the gene track near the marker - this will show a feature highlight triangle :

Click on the feature highlight triangle - this will show the Feature name as a label on the left of the triangle :

If the Feature label is obscured by the axis tick labels, they can be switch off by clicking on 'Show Axis Text' in the View panel, toggling it off :

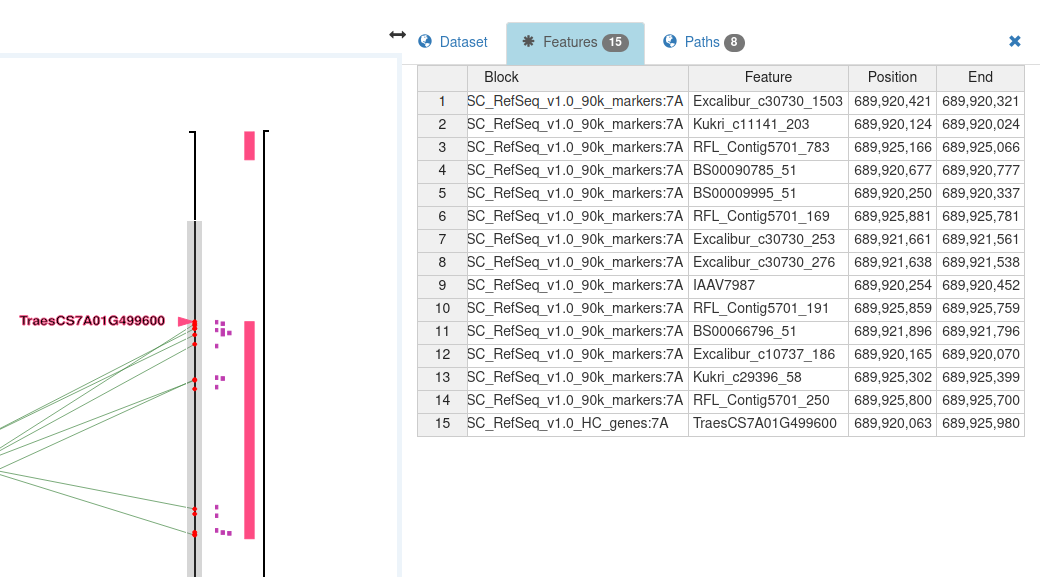
By narrowing the axis brush to the region of interest, just the related markers will be shown in the (Selected) Feature Table :

Click on Search in the left panel, which shows the 'Feature Search' component :

Input the names of the genes you wish to search for in the 'Features Input' field :

Clicking on 'Search' will display a list of the chromosomes (Blocks) of Datasets which contain a Feature with a name in the search input text.
For further detail, see Feature Search Results.
By clicking on the  button, the chosen blocks will be added to the graph view, and their matching features will be highlighted with triangles.

Click on the axis title to display the Axis Title Menu.

Click on the
 to open the Split Axis, showing the genes track, which shows binned feature counts at this level of zoom.

Zoom in to the matched gene and brush the axis in its vicinity, covering some of the neighbouring genes; the genes within the interval of the axis brush are selected :

Note that the red circle for each selected feature is shown at the start position of the feature.
The selected features are displayed in the feature table :

This gives the position of the gene which was sought, and its relationship to neighbouring genes.
Consider a genetic map which has been added to the graph view of Pretzel : brushing on the axis (as discussed in Introduction : Split Axis ), will highlight the loaded features in that region, and display their name and position in the Features Table in the right panel. Brushing a region of the axis will also send a request to the server for features in the region in addition to those which are already loaded.


As discussed in Introduction : Split Axis,
the width of the right panel can be adjusted by moving the mouse cursor over this resize symbol
 , holding down Shift, clicking with the left mouse button and dragging left / right.
In the Features Table the feature names column can be selected, by clicking on the column heading, or by clicking on one Feature name cell in the table and dragging the cursor vertically to another cell before releasing the mouse button.

The names of the selected features are also appended to the Feature Search input field, in the left panel :

Clicking on 'Search' will display a list of the chromosomes (Blocks) of Datasets which contain a Feature with a name in the search input text.

The number of matching features of each matched Block is shown. The Blocks are sorted with those with the most matches at the top (i.e. in descending order by this count) Hovering on the number will display the list of matching Feature names in that Block (this will be changed to a click action).
The search result will also highlight the matching Features in the graph with a triangle

By clicking on the  button, the chosen blocks will be added to the graph view, and their matching features will be highlighted with triangles.

Clicking on a feature highlight triangle will show the feature name as a label to the left of the feature highlight triangle.

Clicking again will toggle this label off.
Shift-clicking a feature highlight triangle will show a spanning line joining it to other feature highlight triangles which have been selected in this way.

Shift-clicking again will toggle this spanning line off for that feature.
It is likely that some of the Feature search results will be too close together for them to be distinguished, so zooming in will enable them to be clicked individually :


A feature highlight triangle can be switched off by clicking on the feature within the Split Axis track :
