Sequence Search
Sequence Search enables searching for nucleotide DNA Sequences, which may be the primers of Markers in genetic maps, or Flanking Markers in QTLs, or exon sequence of genes in an annotation of a reference assembly, etc. This section covers search by nucleotide sequence.
The DNA sequence to search for may be copy/pasted from an external data source such as a spreadsheet or a paper.
The Search tab is in the left panel; it contains 'Feature Search' and 'DNA Sequence Blast Search ', which is half-way down the panel.

The 'DNA Sequence Input' field accepts input in FASTA format, with extensions provided by the blastn search tool which implements the search.
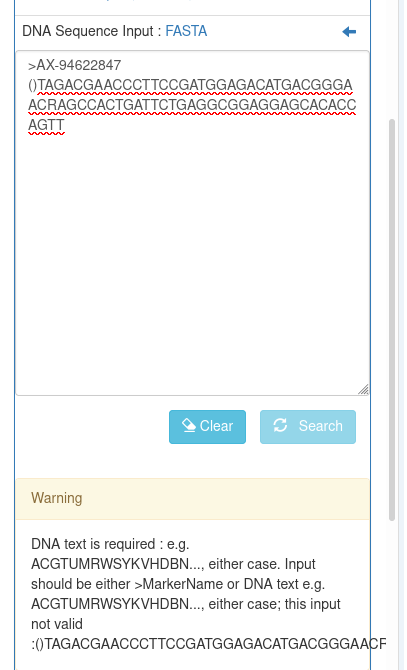
Given a marker, e.g. AX-94622847, and identifying DNA sequence : TAGACGAACCCTTCCGATGGAGACATGACGGGAACRAGCCACTGATTCTGAGGCGGAGGAGCACACCAGTT the input to 'DNA Sequence Input' field will be :
>AX-94622847
TAGACGAACCCTTCCGATGGAGACATGACGGGAACRAGCCACTGATTCTGAGGCGGAGGAGCACACCAGTT

If the input does not match FASTA format, or does not have the required marker name, a message is displayed here :
The name of the reference assembly to search is a required input; select the pull-down 'Reference to search' to choose the reference assembly to search. If this is not done a warning message will be displayed.
If there are no warning messages then the 'Search' button will be enabled.
Click on the 'Search' button
A search typically takes 10-30 seconds. When received, the results will be displayed in the 'Blast Output' tab. A new tab is created for each search result, identified with a timestamp :

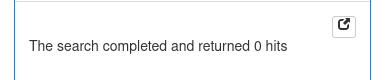
Clicking on the 'Blast Output' tab :

will display 'Searching' until the search completes, and then the result, which in this case is empty because the %ID was too high :
Reducing the %ID constraint :

will increase the number of results.
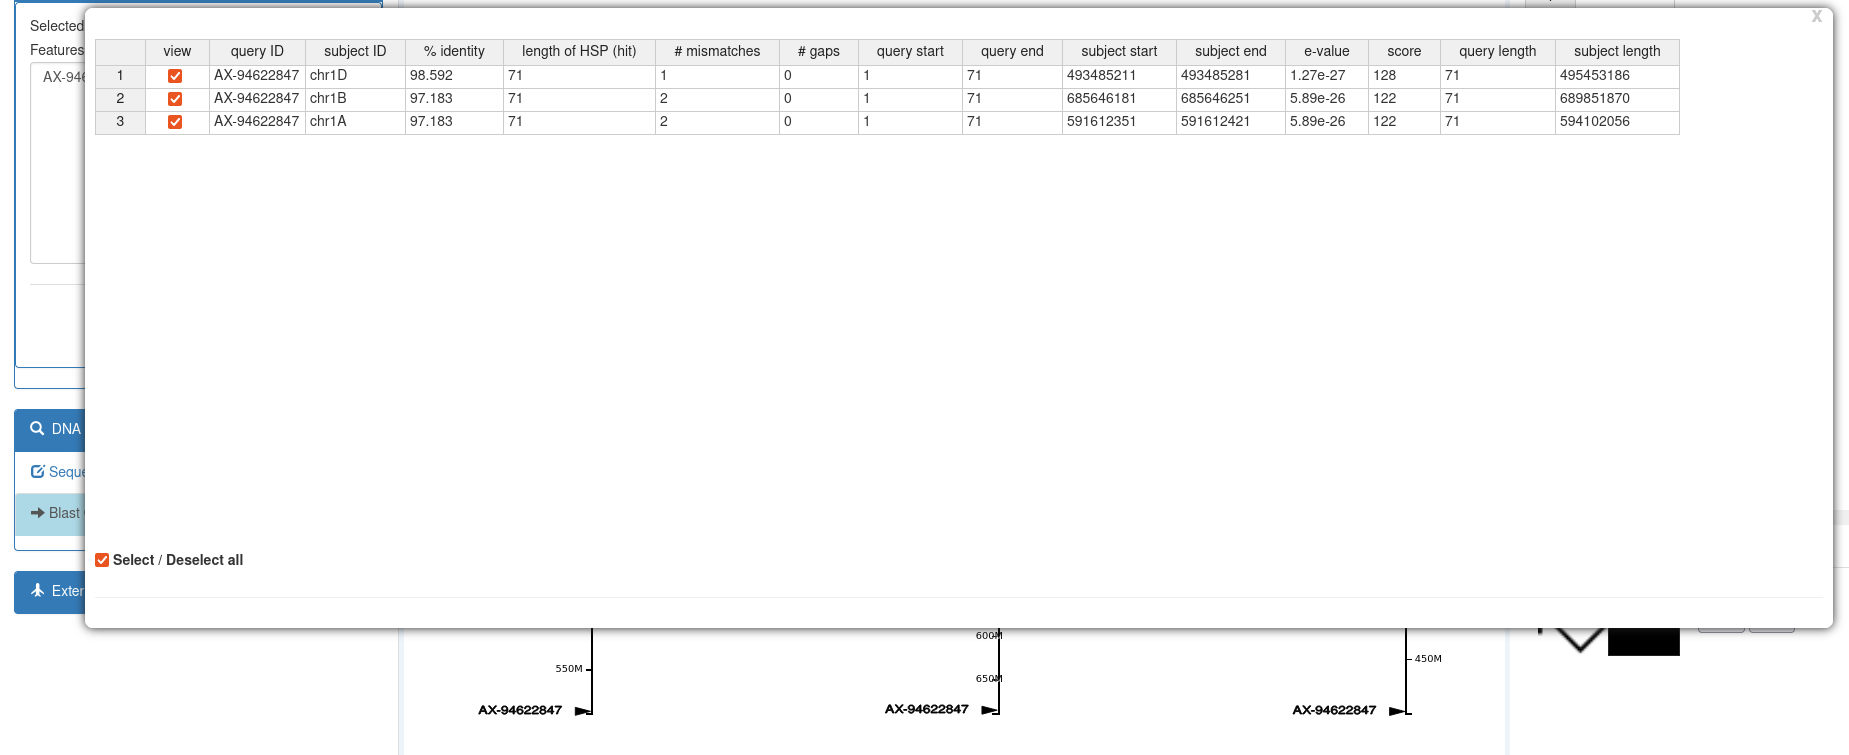
Within the width of the left panel only the first columns of the result table can be displayed. By clicking on then Blast Output dialog button :

the result table will be shown in a full-width table modal dialog, displayed over the top of the graph :
Click on the
 in the top-right corner of the Blast Output dialog will switch back to displaying the Blast Output in the left panel.
The view column of the Blast Output table (left-most column) contains a checkbox which enables display of that row in the graph area :

The Blast Output results are displayed in the graph for only the currently-selected 'Blast Output' tab. Switching to another 'Blast Output' results tab will change to showing the newly-selected output. Switching to the 'Sequence Input' tab will not show any results in the graph area.
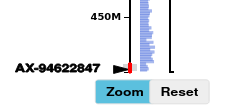
The locations reported in the blast results are highlighted on the graph axes using a solid black triangle pointing right towards the axis, and a text label with the marker name which you input after '>' in the 'Search Input' field.
To see the relationship of the search results with other datasets, use the dataset explorer to add e.g. HC genes to the view :

Because the parent / reference of the HC genes dataset is the same as the reference chosen for the blast search, they are displayed on the same axis.

To see the detail of the adjacent genes : split the axis (see Split Axis ), and zoom using axis brush and / or mousewheel zoom :
Hovering the mouse cursor over the HC gene rectangles in the split-axis track will display the gene name in the top-right of the graph area.

Brushing again around the region including the search result and the nearby genes

will display the gene names and locations in the Features Table, on the right :
