-
Notifications
You must be signed in to change notification settings - Fork 13
Upload
This page covers upload via a spreadsheet file.
For an overview of uploading datasets, see Importing Data
Spreadsheet files can be uploaded into Pretzel via Drag-and-Drop into the Upload tab in the left panel :
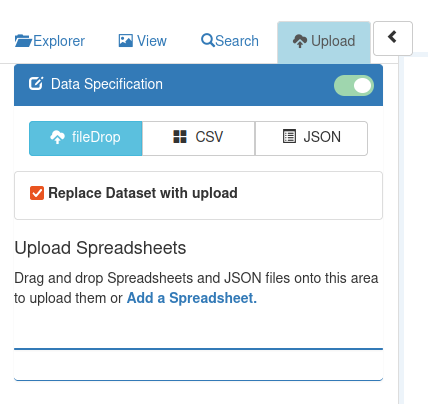
The steps are :
- navigate your operating system file explorer to the folder (directory) containing the file
- click on the file and hold the mouse button depressed
- drag to the drop zone in the Upload tab. When you reach the drop zone, the text 'Upload Spreadsheets' will change to 'Drop to Upload'
- release the mouse button.
The text will change to 'Uploading Dataset', and then either "Success : Dataset '...' Uploaded successfully" or an error message will be displayed. (If you find the error message does not give enough information to enable you to change the dataset, we'd welcome this as a feature request, as the aim is to describe errors sufficiently that users can easily adjust their dataset to enable upload).

The checkbox 'Replace Dataset with upload' controls whether the dataset will replace a dataset of the same name if one already exists on the server. This is ticked by default; un-check it if you don't want to replace an existing dataset.
The dataset will be listed in the explorer; if you view it and the features / markers are not shown, it may be necessary to refresh the Pretzel browser tab (e.g. close the tab and open a new one, or place the mouse cursor in the browser URL address line and hit enter, or Control-R for refresh).
Using a spreadsheet for upload enables :
- combining in a single file all the different worksheet types relating to a specific species / variety / project. This enables related data to be organised together and ensures that the version of datasets in the worksheets are synchronised.
- users can continue to work with their existing spreadsheets, with minor changes required to some column headers, so these remain their definitive data source.
- minimal effort to re-upload after making changes / additions to their data
Each dataset corresponds to a single worksheet in the spreadsheet file. The worksheet name identifies the type and name of the dataset which it contains. The spreadsheet file names are arbitrary, and are not limited or interpreted by the Pretzel application.
Pretzel spreadsheet upload supports a number of dataset types; there are spreadsheet templates which give starting worksheets for each of these, and this is the easiest way to start to create a Pretzel spreadsheet dataset. For example, to create a Pretzel spreadsheet dataset in MS Excel, download the template for MS Excel . Opening this template file will create a new spreadsheet, with empty worksheets which illustrate the required columns for each dataset type.
In this spreadsheet, there are a number of worksheets :
- a short user guide describing the format; this can be left in place for reference as it is not read by Pretzel. This is based on (and links to) this development comment , which has also been incorporated into this page.
- Metadata. This worksheet provides metadata for the datasets contained in the following worksheets.
- dataset worksheets : Map|, SNP|, Alignment|, QTL|, Genome|.
- Chromosome Renaming : this handles the case where chromosome names in the spreadsheet reflect the data pipeline, rather than the Chromosome name which should be displayed in Pretzel
- Chromosomes to Omit : users can exclude selected chromosomes from the upload; this is used for linkage groups which are not substantial enough to warrant uploading.
- Map|
- SNP|
- Alignment|
- QTL|
- Genome|
Vertical bar | is used as the separator between the worksheet dataset type label and the dataset name.
The dataset name appears after the label, e.g. 'Map| Red x Blue' (outside spaces will be trimmed)
Additional worksheets which don't match the names defined above are ignored - this enables users to keep additional information and data preparation worksheets in the same file.
In the dataset worksheets, the data columns expected by Pretzel depends on the type of dataset. The column headings identify the role of the data in that column, and the columns required for each dataset type are given fixed names to enable Pretzel to parse the data. Additional columns may be given; they will be loaded into the Feature.values structure, and displayed in the Feature table when the axis brush is applied. To exclude a column from upload, prefix the column heading with #.
There are 2 distinct worksheet types for SNP (which has a 1 bp position) and Alignment (which has Start / End), e.g. the alignment of probes (for SNPs) to a reference assembly.
Any of the worksheets may contain comments : # comment (i.e. # at the start of the value in column 1).
This can be used in dataset worksheets to exclude single rows from the upload.
This illustrates how metadata is assocated with a dataset worksheet 'Alignment|EST_SNP'. The column heading is the worksheet name : 'Alignment|EST_SNP'. A column is added for each dataset worksheet.
'Metadata' :
# Add columns for each dataset in Workbook
| Field | Alignment|EST_SNP |
|---|---|
| commonName | Lentil |
| parentName | Lens_culinaris_2.0 |
| platform | SNP_OPA |
| shortName | SNP_OPA |
The left column is a 'row heading' : it identifies the metadata value, and the 4 shown are recognised by Pretzel. For example the parentName value identifies the dataset which defines the range of Feature values, or contains the features named in 'Flanking Markers'. Extra field names other than these 4 will be placed in Dataset.meta.fieldName : value e.g. source, citation, notes, year, ...
This is used to rename the value of the Chromosome column during the upload.
| From | To |
|---|---|
| Lcu.2RBY.Chr1 | Lc1 |
| Lcu.2RBY.Chr2 | Lc2 |
| Lcu.2RBY.Chr3 | Lc3 |
| Lcu.2RBY.Chr4 | Lc4 |
| Lcu.2RBY.Chr5 | Lc5 |
| Lcu.2RBY.Chr6 | Lc6 |
| Lcu.2RBY.Chr7 | Lc7 |
This is used to omit from the upload, data for selected Chromosomes contained in a dataset worksheet; e.g. the user may select to omit some non-substantial linkage groups.
| Lcu.2RBY.unitig |
- Map:
| Marker | Chromosome | Position |
|---|
- SNP:
| Name | Chromosome | Position |
|---|
- Alignment :
| Name | Chromosome | Start | End |
|---|
- QTL :
| Name | parentName | Chromosome | Trait | Start | End | Flanking Markers |
|---|
If all the data has the same reference / parent, the parentName column can be omitted and this value specified instead in the column of the Metadata worksheet corresponding to this dataset.
The values given in the 'Flanking Markers' column are expected to be present in the parent / reference dataset. The 'Flanking Markers' define the position of the feature, i.e. when displayed in Pretzel, the positions of the identified Flanking Markers are combined to define a range, which is shown as the interval of the Feature. Either 'Flanking Markers' and / or Start (and optional End) can be given; the 'Flanking Markers' are used in preference.
- Genome :
| Chromosome | Start | End |
|---|
Additional columns other than these fields : values are placed in Feature .values.fieldName, or for Genome : Block.meta.fieldName
These columns Pretzel recognised these column headings and assigns a specific role to them :
- Ref The Ref and Alt of a SNP, displayed in the Feature hover text.
- Alt
- Sequence (equivalent : SEQ, Primer). This value can be accessed by the button the Sequence Search (Blast) tab.
The simplest type of dataset upload is a genetic map, and the following will step through the creation of a genetic map dataset to illustrate the process, using this map data.
-
From the paper's Supplementary Material, media-6.csv
-
open the template MS Excel

- Open media-6.csv as a spreadsheet, and copy the first 3 columns. Alternately, using linux command-line : cut --delimiter=, --fields=1-3 < media-6.csv > media-6.markerChrPos.csv
media-6.markerChrPos.csv :
| Marker ID | Chr | pos |
|---|---|---|
| BS00023118 | 1A | 0 |
| BS00026453 | 1A | 25 |
| BS00062783 | 1A | 37.2 |
| BS00016654 | 1A | 65.3 |
| ... | ||
| BS00040283 | 7B | 64.1 |
| BS00083352 | 7B | 74.6 |
| BS00077071 | 7D | 0 |
| BS00023159 | 7D | 2.87 |
Copy the 3 columns into the clipboard.
-
in the spreadsheet file created from the Pretzel template, select this worksheet : 'Map| Template Map Dataset Name'
-
click the A2 cell (the start of the blank row after the heading row), and paste in the 3 columns
-
the file media-6.csv had a row of column headings : "Marker ID Chr pos". Pretzel accepts the abbreviations Chr and pos, but 'Marker ID' won't be recognised, so delete this row,

leaving the column headings from the template : "Marker Chromosome Position"

- rename the Map worksheet to indicate the dataset name; in this example, the first author of the paper is given as dataset name : 'Map| Yermekbayev'


- make the same change in the 'Metadata' worksheet :
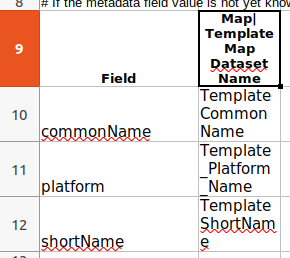
and change the commonName and platform fields to describe the dataset

The shortName field can be given a value also, or commented out using # as is shown here.
- delete the empty template dataset worksheets which are not required, leaving the Metadata worksheet and the Map :

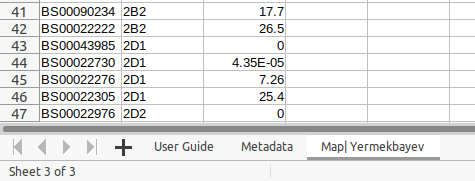
The 'Chromosome Renaming' and 'Chromosomes to Omit' worksheets have been deleted as they are not required. The 'User Guide' worksheet can be retained if it is a useful reference.
-
save the spreadsheet and give it a file name
-
as described above, Drag-and-drop the spreadsheet file from the file explorer of your OS to the 'Upload Spreadsheets' component in the Upload tab : fileDrop

- the dataset will now be shown in the dataset explorer :

-
refresh the browser tab before viewing the dataset (this will not be required after some changes are made to update Pretzel after an upload).
-
view the selected chromosomes of the genetic map.

QTL upload is a more complex dataset than Genetic Maps
For a QTL the key columns required by Pretzel are : . Name, Chromosome, parentName, (start, end) and/or (Flanking Markers)
Additional columns which are recognised : Trait, Ref, Alt, SEQ.
All columns, including these, are shown in the Features Table, when QTLs / features are selected using axis brush. The column headings of the feature table are the column headings from the spreadsheet, and they are the union of the columns for the currently selected features, so it is OK if some cells are blank for some features (e.g. QTLs).
The spreadsheet template has these columns for the QTL worksheet :
| Name | parentName | Chromosome | Ontology | Trait | Start | End | Flanking Markers | Reference | Sequence |
|---|
The essential columns are highlighted with bold headers :
| Name | parentName | Chromosome | Trait | Start | End | Flanking Markers |
|---|
The position of the QTL can be identified by a combination of Start, End, Flanking Markers. End is optional. Either Start or Flanking Markers is required.
The following will step through the creation of a QTL dataset to illustrate the process.
- open the template MS Excel

- this creates a new empty spreadsheet, Untitled1.


Select the QTL worksheet and rename it to indicate your dataset name. Change the name from 'QTL| Template Map Dataset Name' to 'QTL| Your Dataset Name goes here '.


Make the same name change in the 'Metadata' worksheet, in the row which starts with 'Field' :

In this example, the commonName value has been set to 'wheat', and the values in the other fields can be commented-out by inserting a leading '#', which means they will not be included in the dataset metadata.
Delete the worksheets which are not required :
- 'Chromosome Renaming'
- 'Chromosomes to Omit'
- 'Map| Template Map Dataset Name'
The QTL worksheet has these column headings :
| Name | parentName | Chromosome | Start | End | Trait | Ontology |
|---|
Paste in 1 row of some sample data, e.g. :
| Name | parentName | Chromosome | Start | End | Trait | Ontology |
|---|---|---|---|---|---|---|
| bc1 | Triticum_aestivum_IWGSC_RefSeq_v1.0 | 1A | 1000000 | 3000000 | bread crumb structure | CO_321:0000065 |
Save the spreadsheet file, giving it a name and placing it in a folder you have created for your datasets.
Drag & drop the spreadsheet file into the 'Upload Spreadsheets' tab in Pretzel, as described in Uploading Datasets via Spreadsheet files
This message will be displayed below the 'Upload Spreadsheets' tab to indicate completion of the dataset upload :
Success Dataset 'Quick - Triticum_aestivum_IWGSC_RefSeq_v1.0' Uploaded successfully

You can now see your dataset in the 'Dataset Explorer' tab. To see it easily, enter into the 'Search All Datasets' input field, part of the name you gave the dataset, in this case 'quick' :
The dataset search is case-insensitive by default. You can change this by clicking on the 'Case insensitive' toggle to change it to 'sensitive'

To view the chromosomes of the dataset (in this case just 1), click on the
 to expand the dataset contents.
Click on the
 button to add this Chromosome of the dataset to the graph view.
The dataset is Private by default - that is it will only be visible to you. In the 'All Datasets' tab, there are controls to make the dataset Public, and also to delete it.
Because the dataset is a QTL, it is also visible in the QTL tab :

By brushing on the axis around the position of the QTL, you can select it, which displays it in the 'Features Table' on the right side.


In this example we will start from an existing spreadsheet and integrate it with the column headings and 'Metadata' worksheet required for a Pretzel spreadsheet upload. The example shows how to identify the key columns which Pretzel requires, and how to label the other columns, so that they will be included in the dataset update.
To get your spreadsheet into Pretzel format, it will need at least the Metadata worksheet from this empty spreadsheet. You can combine them either by copying the Metadata worksheet from this empty spreadsheet to your spreadsheet, or vice versa :
- add your spreadsheet to the new spreadsheet, e.g. by copying the worksheet from your existing spreadsheet to the new spreadsheet.


- change the name of the copied worksheet to : 'QTL| Your Dataset Name goes here '


- insert an empty row at the top of the worksheet, and copy the column headings from this worksheet from the Pretzel template : 'QTL| Template Map Dataset Name' to the copied worksheet (containing the data).


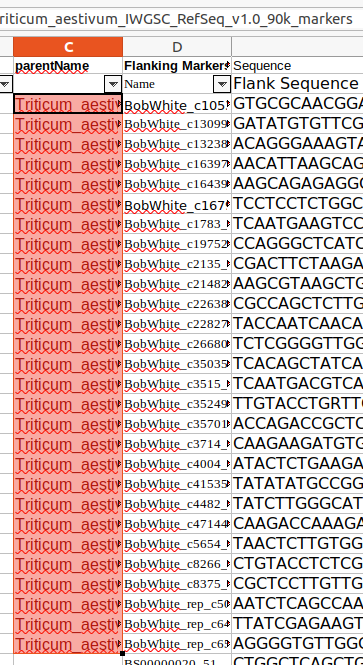
The parentName can be defined in the Metadata worksheet; in this case there are different parent references for the QTLs within the worksheet, so it is defined for each QTL row by adding a parentName column :

Existing headings can be copied to the first row. Currently punctuation is not supported in headings, so replace punctuation with e.g. underscore '_' :


-
Use the column heading which Pretzel will recognise for the required columns :
-
Identify the 'Flanking Markers' column :

- Identify the Chromosome column :

- Identify the Trait column :

- Identify the Sequence column :

- Comment-out the original headings, if retaining them for reference (or delete the original headings row) :

- Ontology is an optional column. Identifying Trait by Ontology will allow for more effective search of the datasets.
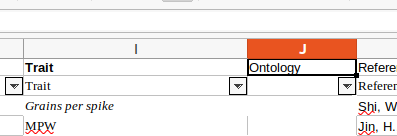
- In this case the Ontology does not yet have any content, so it can be commented-out :

- renaming a column heading :
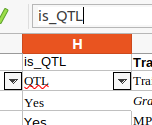
- To identify the parentName, copy/paste some of the marker names :

- and search for them using Feature Search (in the left panel) :
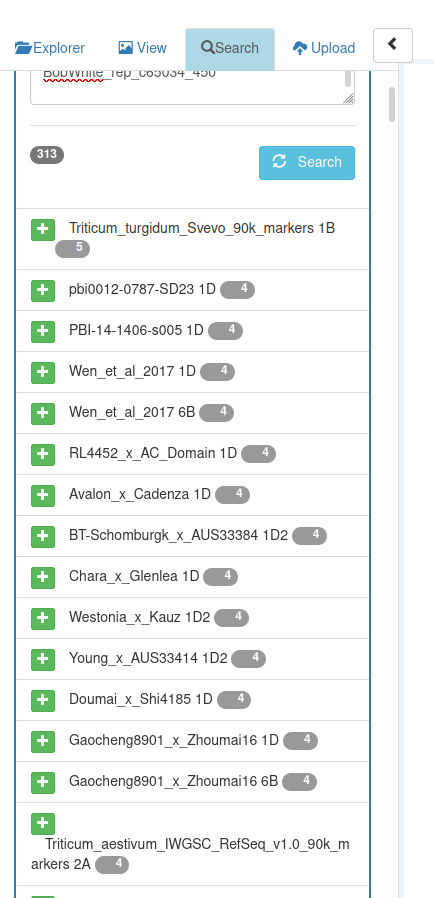
- Having identified the parent which the marker names refer to, fill the parentName column for those QTLs :

