-
Notifications
You must be signed in to change notification settings - Fork 23
plot_matches
plot_matches is used to create dotplots of matches in the stream. The matches are found using
match_seq. Default graphics are crufty ASCII and you probably want high resolution postscript
or SVG output instead with is easy using the -t switch. Plotting is done using GNUplot which
allows for different types of output the default one being crufty ASCII graphics.
plot_matches uses Q_BEG, Q_END, S_BEG, S_END, and STRAND keys from the stream.
GNUplot must be installed for plot_chrdist to work. Read more here:
... | plot_matches [options]
[-?          | --help]               #  Print full usage description.
[-x          | --no_stream]          #  Do not emit records.
[-o <file>   | --data_out=<file>]    #  Write result to file.
[-t <string> | --terminal=<string>   #  Terminal for output: dumb|x11|aqua|post|svg|png     -  Default=dumb
[-d <string> | --direction=<string>  #  Direction of matches to plot: both|forward|reverse  -  Default=both
[-T <string> | --title=<string>]     #  Set plot title               -  Default=plot_matches
[-X <string> | --xlabel=<string>]    #  Set x-axis label.
[-Y <string> | --ylabel=<string>]    #  Set y-axis label.
[-I <file!>  | --stream_in=<file!>]  #  Read input from stream file  -  Default=STDIN
[-O <file>   | --stream_out=<file>]  #  Write output to stream file  -  Default=STDOUT
[-v          | --verbose]            #  Verbose output.
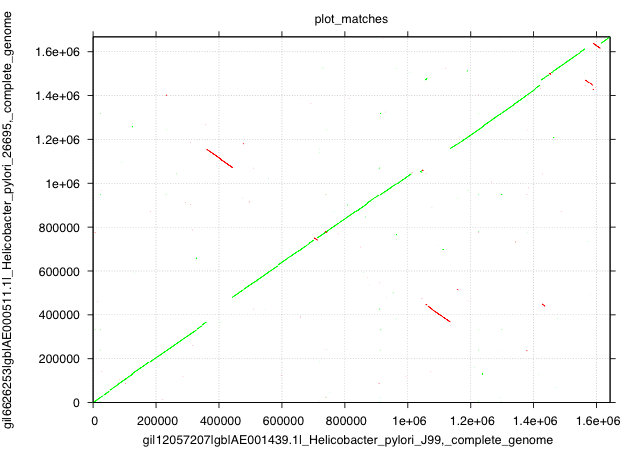
To create a dotplot of two Helicobactor pylori genomes first read in the sequence with read_fasta, then find all matches between the genomes using match_seq:
read_fasta -i H.pyl_26695.fna,H.pyl_j99.fna | match_seq | plot_matches -xt post -o dotplot.ps
And the result will look like this:

If you choose -t svg instead of -t post the output will be in SVG which is
neat since it can easily be modified using e.g. Inkscape to apply labels and such.
Read more about Inkscape here:
Martin Asser Hansen - Copyright (C) - All rights reserved.
August 2007
GNU General Public License version 2
http://www.gnu.org/copyleft/gpl.html
plot_matches is part of the Biopieces framework.